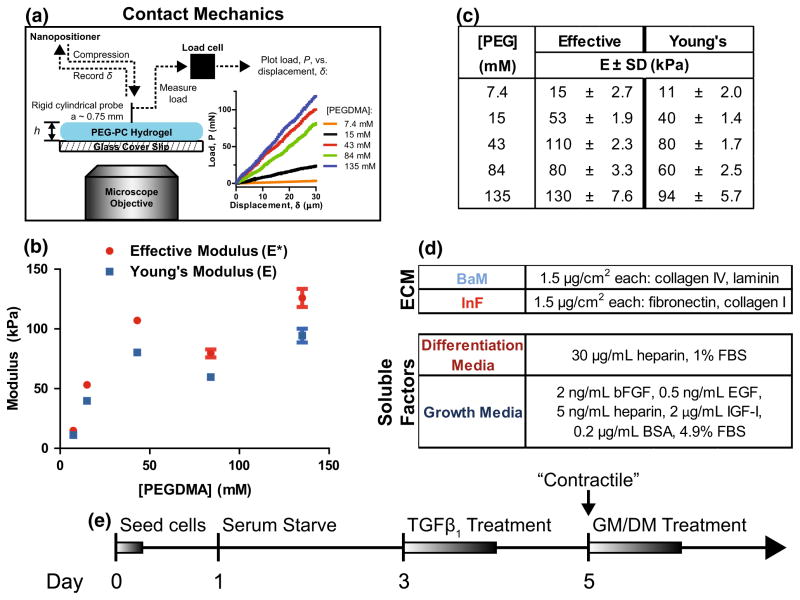
FIGURE 1.
PEG-PC hydrogels that mimic the in vivo microenvironment of SMCs. (a) PEG-PC hydrogel elastic modulus on glass coverslips was measured with contact mechanics by bringing a cylindrical probe into contact with the gel surface and measuring the force, P, vs. displacement, δ, with a displacement rate of 0.5 μm/s. Data is plotted with compressive force and displacement values being positive (b) The effective modulus, E*, was measured over a range of [PEGDMA] concentrations from a minimum of three samples per condition, and used to calculate a Young’s modulus, E, with an estimated Poisson’s ratio of 0.5. (c) PEG-PC mechanical data plotted as a function of crosslinker (PEGDMA) concentration. (d) Two different compositions of adhesive proteins and soluble factors were used to reflect changes in the arterial microenvironment. (e) Timeline of experiments. “Contractile” denotes phenotype synching; GM and DM are growth and differentiation mediums, respectively.

