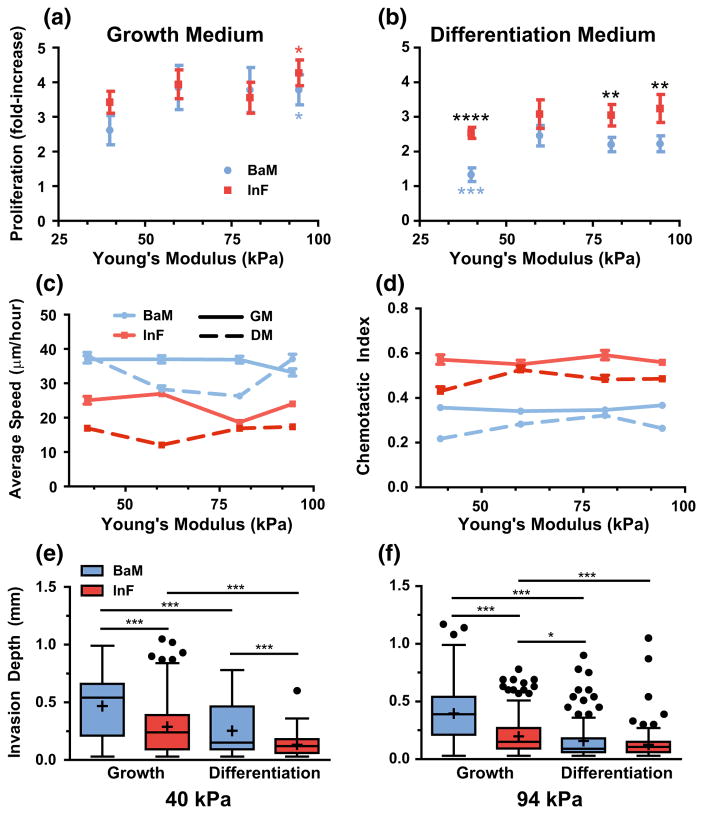
FIGURE 2.
Physicochemical effects on SMC growth and motility. (a, b) SMC proliferation at 4 days of culture was measured as a function of hydrogel modulus (x-axis), on either BaM (blue) or InF (red) proteins, and stimulation with either growth medium (a) or differentiation medium (b). An asterisk (*) indicates significantly different from softest condition. Black asterisks (*) indicate significance at that stiffness, blue asterisks (*) indicate significant difference from stiffer BaM conditions. Error bars are ± SEM with N = 5–6 independent biological replicates. (c, d) SMC migration speed (c) and chemotactic index (d) was quantified as a function of Young’s modulus (x-axis) on the different integrin-binding proteins (colors) and stimulated with medium conditions (solid and dashed lines). Error bars are ±SEM with N>100 cells and at least 3 independent biological replicates. (e, f) In a collagen gel invasion assay, SMCs were seeded on two different stiffness gels, and on the two protein combinations (colors). Their invasion into an overlaid collagen gel was measured in both medium conditions (x-axis). Data is presented as Tukey box plots with N>100 cells from at least 3 independent biological replicates (with the exception of 2 independent replicates for soft BaM in differentiation medium.).

