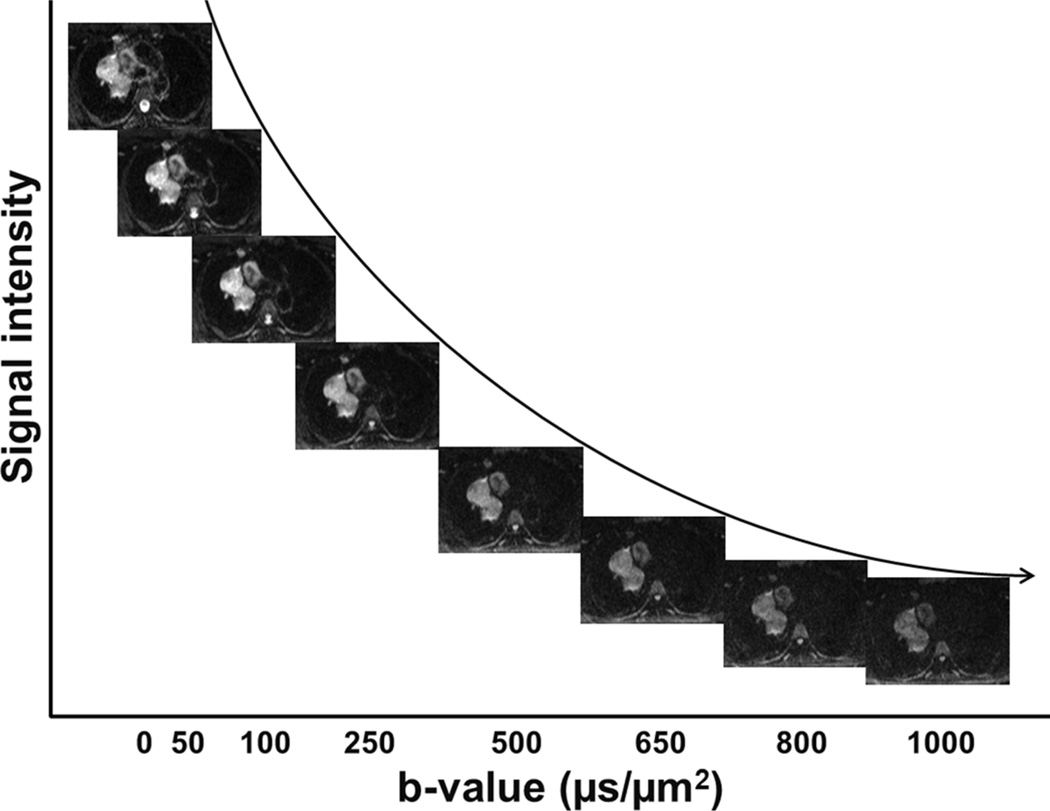
Figure 1.
Illustration of DW-MRI signal decay of various types of tissues with respect to b-value. The labels in x-axis correspond to the b-values of the DW-MRI image above them. The curve represents the exponential decay of mean signal of the tumour region in arbitrary unit (not to scale) with respect to b-value.

