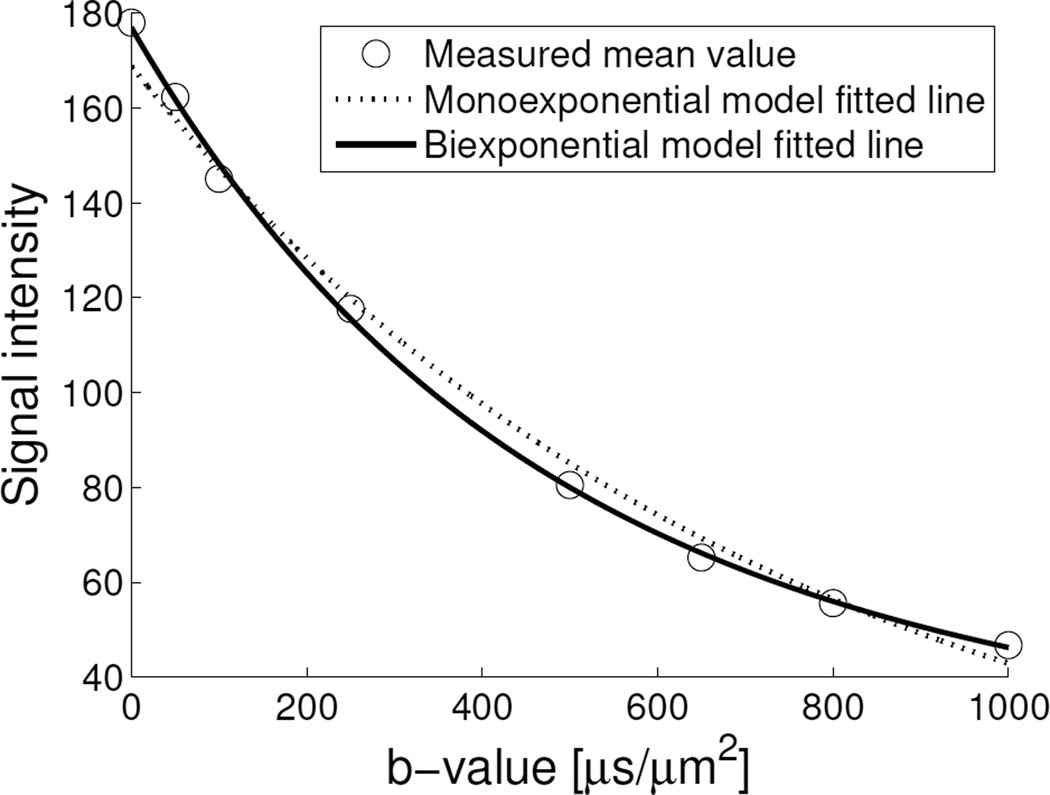
Figure 2.
Plot of an active tumour volume mean signal intensity (S) vs b-value fitted by monoexponential (adjusted R2 = 0.9860) and biexponential, i.e. IVIM (adjusted R2 = 0.9977) models. Using F test, the IVIM model gave a significantly lower residual fit error to the signal vs b-value data of active tumour volume of this subject’s DW-MRI scan than the monoexponential model at 5% significance level. At low b-values, the signal decay originates from both perfusion (fast component) and diffusion (slow component), whereas at high b-values, mainly from diffusion.

