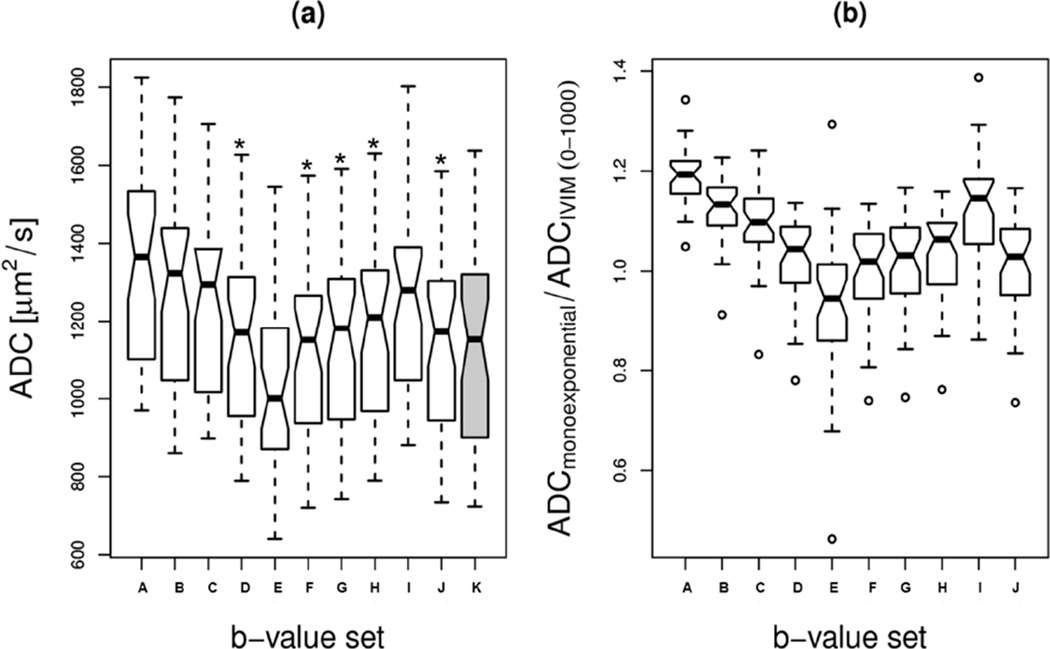
Figure 5.
ADC values (a), and normalized ADC values relative to ADCIVIM (b) of active tumours from 40 DW-MRI scans of (A) 0–1000, (B) 50–1000, (C)100–1000, (D) 250–1000, (E) 500–1000, (F) 250, 500 and 1000, (G) 250, 650 and 1000, (H) 250, 800 and 1000, (I) 250 and 800, (J) 250 and 1000 µs/µm2 b-value sets. The b-value set (K) corresponding to gray shaded box in panel (a) represents the 0–1000 µs/µm2 set for reference-standard ADCIVIM values. The star symbol represents the ADC values that were not significantly different from the ADCIVIM values (p > 0.05, paired t-test). The small open circles in panel (b) represent the individual data points that are either below Q1 − 1.5×IQR or above Q3 + 1.5×IQR, where “interquartile range (IQR)” is the width of the box, i.e., IQR = third quartile (Q3) - first quartile (Q1).

