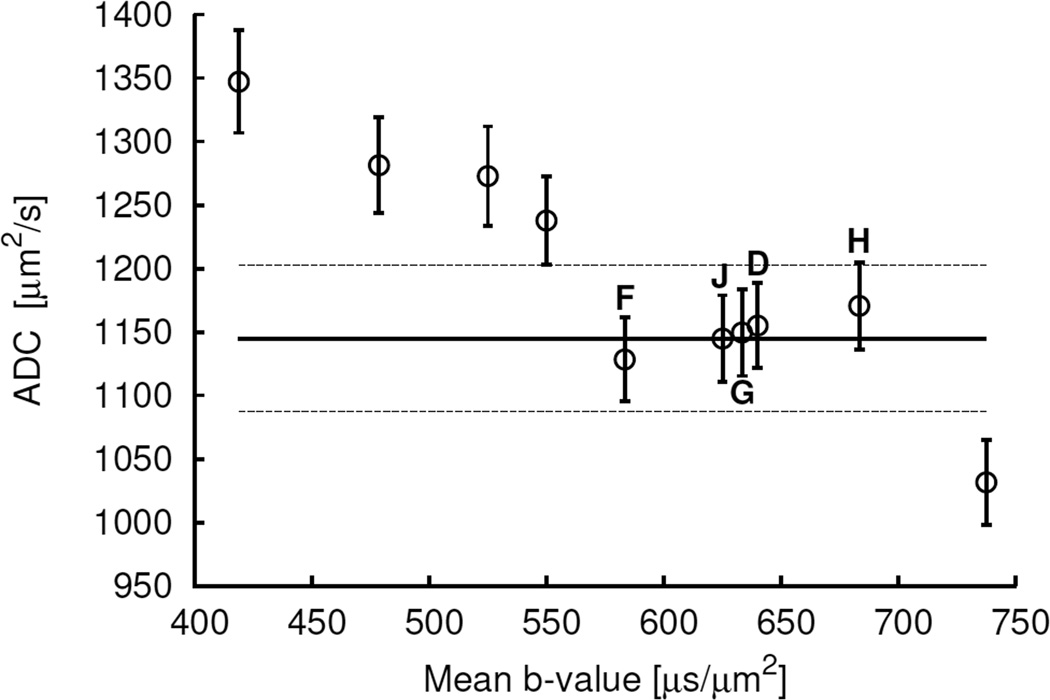
Figure 6.
Plot of the mean (±SE) values of the monoexponential ADC values of active tumour volumes of scans versus mean b-values. The horizontal solid line represents the mean of the reference-standard IVIM ADC values. The horizontal dashed lines represent ±5% values of the mean IVIM ADC value. The data points within the dashed lines from left to right represent the values corresponding to the b-value sets of 250, 500 and 1000; 250 and 1000; 250, 650 and 1000; 250–1000; and 250, 800 and 1000 µs/µm2, i.e. the b-value sets F, J, G, D and H, respectively in Fig. 4 and 5.

