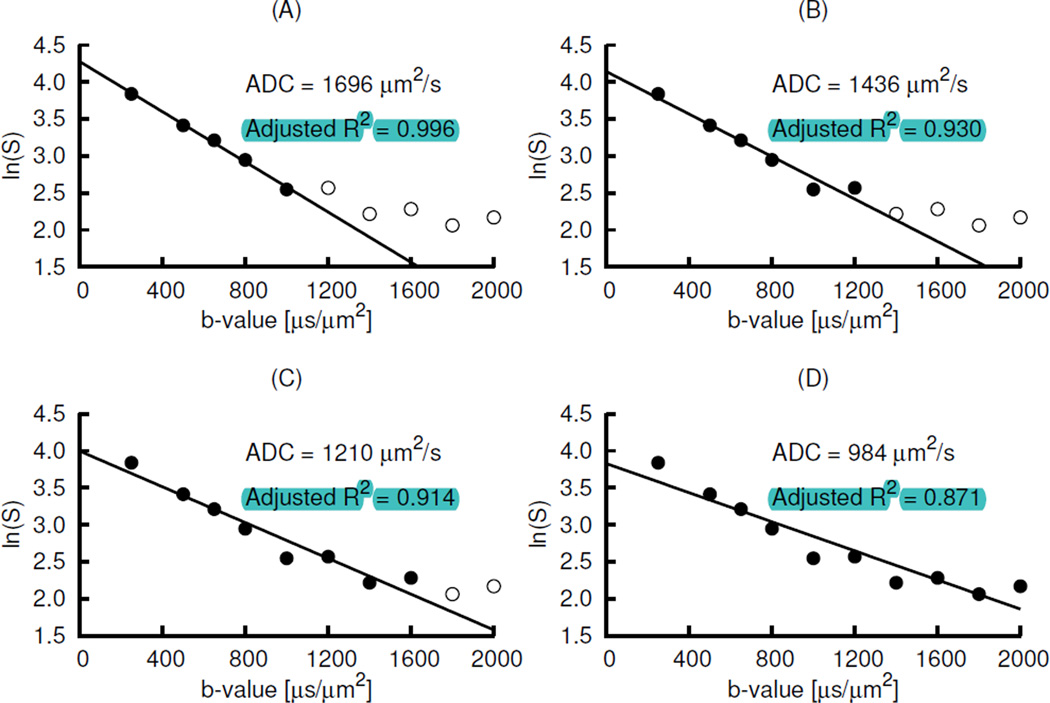
Figure 7.
An example of the effect of the signal intensity (S) vs b-value data below or near noise floor. In the panels of the figure, the data represented by the filled circles of a data set obtained by the Rician noise simulation were fitted by using monoexponential diffusion model for b-values ≥ 250 µs/µm2. The ADC value is the negative of the slope. Panel D has much lower ADC than panel A. Similarly, panel D has lower adjusted R2 than panel A. The data represented by the open circles in panel B are almost below the noise floor.

