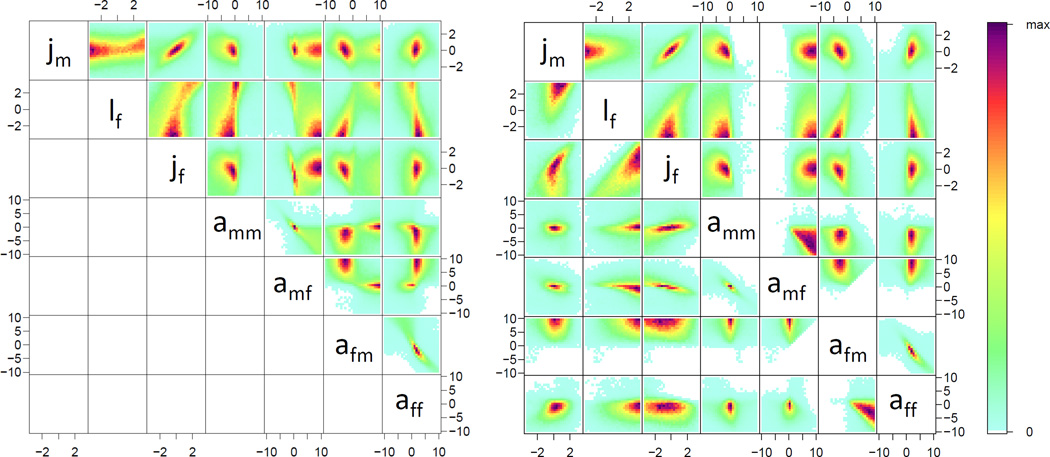
Figure 2.
Bivariate heat map pooling the posterior distributions of parameter estimates of all 30 genotype×density treatments. There is bimodality within afm amf and lf. Bimodal distributions like this may represent a lack of identifiability (see Supplemental Material). Here, for the combination of amf and afm, the two peaks fall into two distinct categories: one in which amf is higher than afm(mfHigh), and one in which the opposite is true (mfLow). Because the joint probability of mfHigh is effectively 1, we conduct subsequent analyses only on mfHigh. On the left plot we show the full dataset. On the right, the model mfHigh is above the diagonal and mfLow is below.


