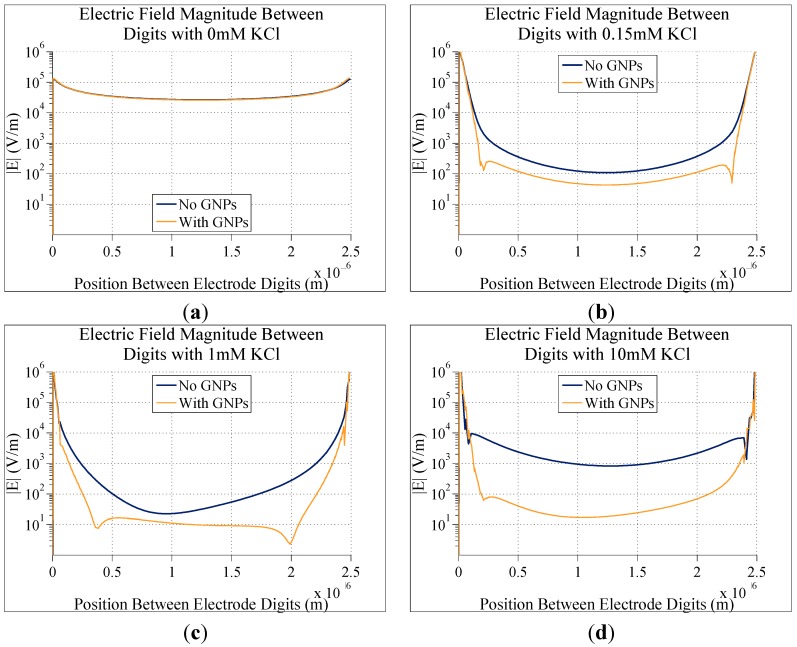
Figure 8.
Graphs comparing the simulated electric field magnitude directly between two digits of electrodes with and without bound gold nanoparticles. In all cases, electrodes consisted of 5 µm digits with 2.5 µm gaps between digits, and 0.1 V DC applied to them. The only difference between each graph is the concentration of KCl in the solution in the electrodes: (a) 0 M; (b) 0.15 mM; (c) 1 mM; and (d) 10 mM.

