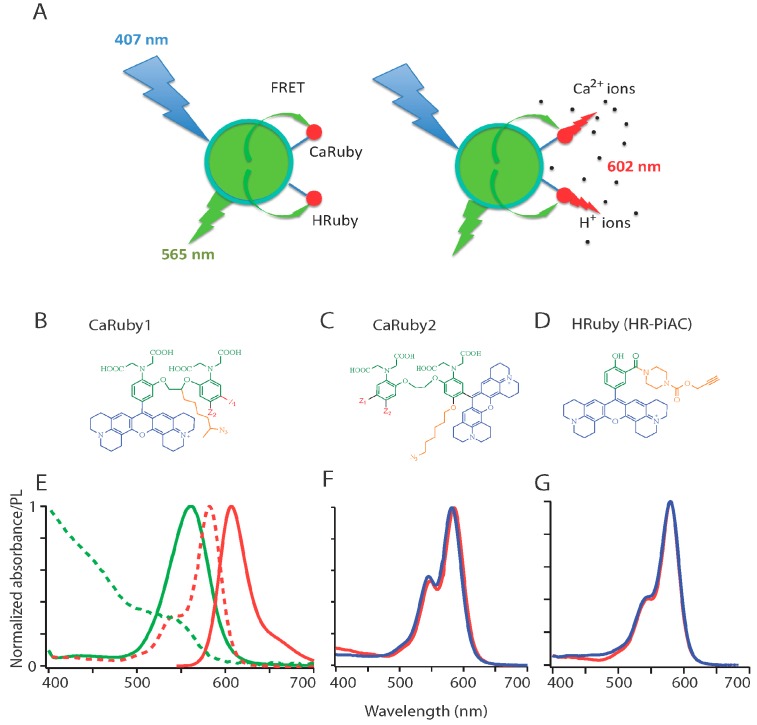
Figure 1.
FRET-based red-emitting ion sensors: (A) Principle. Coupling a green-emitting quantum dot (QD: here CANdot®565) donor to a red-emitting rhodamine-based ion sensor, the acceptor, produces an analyte-dependent FRET signal upon donor excitation at 405 nm. The custom red-emitting ion sensors used here are Ca2+ (alternatively H+) indicators, the emission of which is quenched by PET in absence of their ligand. Analyte binding results in a strong fluorescence peaking at 602 nm; (B–D) Chemical structure of the sensors: All sensors are built on an extended rhodamine moiety (blue). The two Ca2+ sensor families incorporate a BAPTA moiety (green), without (B) and with (C) an oxygen introduced on one of the aromatic ring of the BAPTA for the lower and higher affinity families: CaRuby1 (µM-mM range) and CaRuby2 (sub-µM range), respectively. Substitutions (Z1, Z2 in red with Z1=Cl, Z2=H for the chloride derivatives, and Z1=H, Z2=F for the fluorine derivatives, Z1=H, Z2=Me for CaRu1-Me) yield compounds with a finely tunable KD for Ca2+ binding. The pH sensor family (HRubies, (D)) is based on the addition of a phenol instead of a BAPTA. Note that all compounds bear an azido/alkyne side arm for click chemistry and the resulting potential for high-yield coupling reactions. The azide bearing linker is introduced in the bridge between the two aromatic rings of the BAPTA for the CaRubies1, and on the additional oxygen for the CaRubies2. HR-PiAC bears an alkyne moiety at the ortho position of the phenol through a piperazine carbamate link; (E–G) Spectral properties of retained donor/acceptor pairs (E) normalized absorbance and emission spectra (dashed and plain lines, respectively) of QD565 (green) and CaRu-Me (red). Since there is only a slight Ca2+ sensitivity of CaRu-Me absorbance when switching from EGTA- to 2 mM Ca2+-containing solution, the KDs of CaRu-Me and QDCaRu-Me were similar, as expected. Similar properties are expected with CaRu2-F and HR-PiAC since their absorbance is respectively Ca2+ and pH insensitive, as illustrated in panels (F) and (G), where blue and red traces are in absence and presence of the analyte, respectively.

