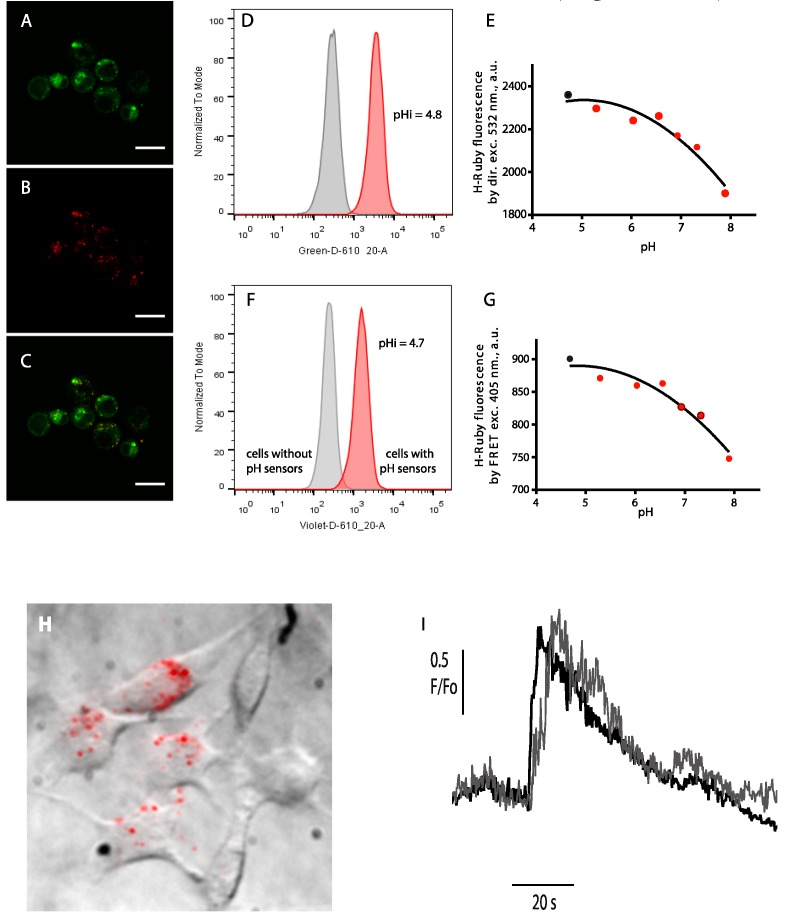
Figure 5.
Live-cell imaging of intracellular ion distributions. (A–C) Confocal images of BHK-21 cells after incubation with QD-HRu PiAC (A) co-stained by Lysotracker Green; (B) and a merged image of the two channels (C). Scale bar is 20 µm; (D–G) Intracellular calibration of pH sensors in a suspension of BHK-21 cells using flow cytometry. Typical histograms showing the internalization of the QD565/H-Ruby pH sensors according to the H-Ruby intensity (in grey, the cell without sensors, and in red, the cells having internalized pH sensors) upon direct (D) and by FRET excitation (F). Calibration curves of the intracellular pH sensors clamped at different pH with the ionophore nigericin were obtained by direct (E) and by FRET excitation (G) of H-Ruby. Intracellular pH as measured by the red histograms of fluorescence H-Ruby in (D,F) was evaluated (black dots) by extrapolation on the calibration curves (E,G), respectively; (H,I) Read-out of local Ca2+ transients upon glutamate application on BHK cells stably expressing the NR1 and NR2A subunits of the N-methyl-D-aspartate receptors (NMDARs). (H) Firstly internalized biosensors (QD-CaRuby-CPP in a ratio 1:10:10) were localized by superimposition of the bright-field and time-averaged TIRF image of cultured BHK cells detected in the green channel upon 405-nm evanescent-wave excitation of the QDs. (I) Repetitive stimulation evokes reversible Ca2+ transients. Superimposed traces obtained in the red channel following 568-nm excitation are responses of the Ca2+ sensor to two successive bath applications of NMDAR agonists at a saturating concentration, with a 15 min long continuous bath perfusion of control saline for recovery from desensitization in between. Figure 5H,I is reprinted with permission from Zamaleeva et al., 2014 [8]. Copyright 2015 American Chemical Society.

