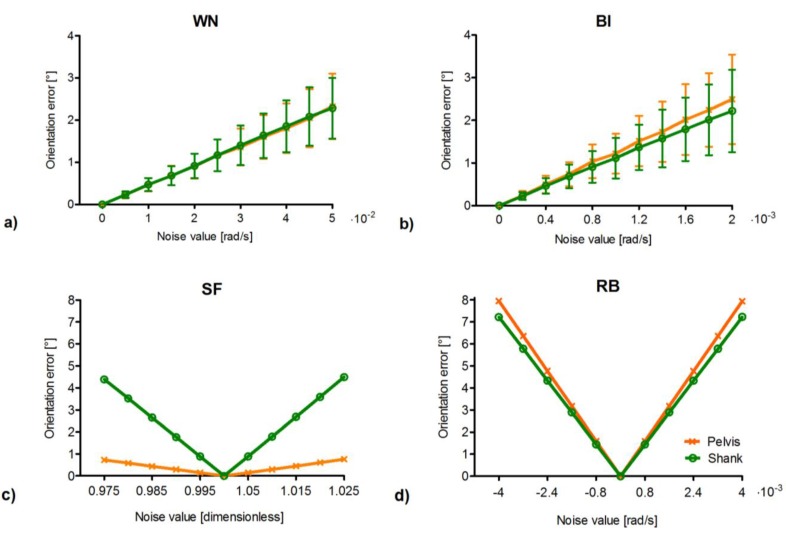
Figure 3.
Orientation error associated to each homogeneously distributed noise type as a function of noise levels for the ideal pelvis (orange) and shank signals (green). (a) WN: white noise; (b) BI: bias instability; (c) SF: scale factor; and (d) RB: residual bias. For WN and BI (a,b) the abscissae indicate the noise level values associated to each gyroscope axis, and the orientation error is reported as mean and standard deviation (vertical bars) corresponding to the five hundred simulation runs of each noise level. For SF and RB (c,d) the abscissae indicate the magnitude of the noise level values. Noise levels are expressed in the International System of Units, whereas the orientation error is expressed in degrees (°) to facilitate its interpretation. (Please note that, for WN, BI, and RB, multiplication factors of 10−2 or 10−3 are reported on the right of the abscissae).

