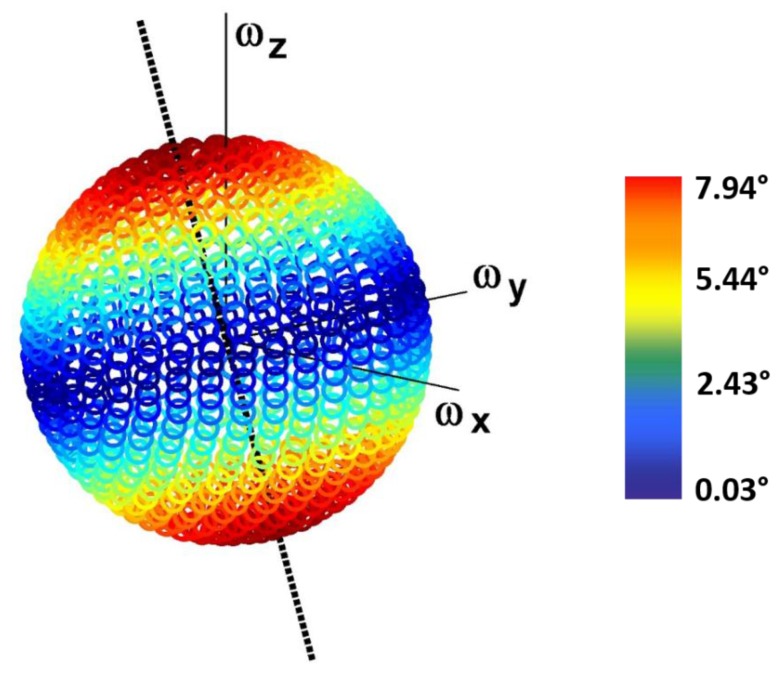
Figure 7.
Distribution of the orientation error due to an RB aligned with the mean direction of the angular velocity in the shank across the sphere representing different 3D distributions of a constant unit angular velocity vector. The error is represented by a color range, from dark red (maximum values) to dark blue (minimum values). The dashed black line represents the direction of the RB vector.

