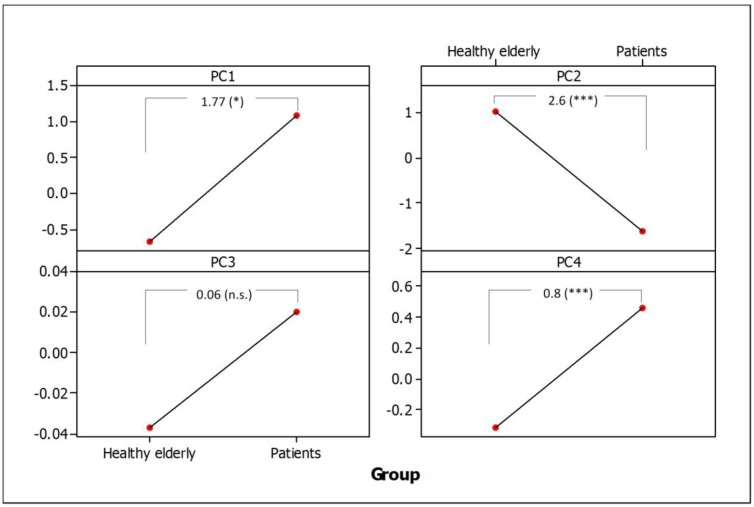
Figure 3.
Mean scores of the first four PCs for healthy elderly subjects and PD patients, corrected for within-individual variation using the LME models. Absolute mean differences and P-values are shown with respect to the healthy elderly group. Symbols: * = p < 0.05, *** = p < 0.001, n.s. = not significant. Group: healthy elderly (n = 876), patients (n = 545).

