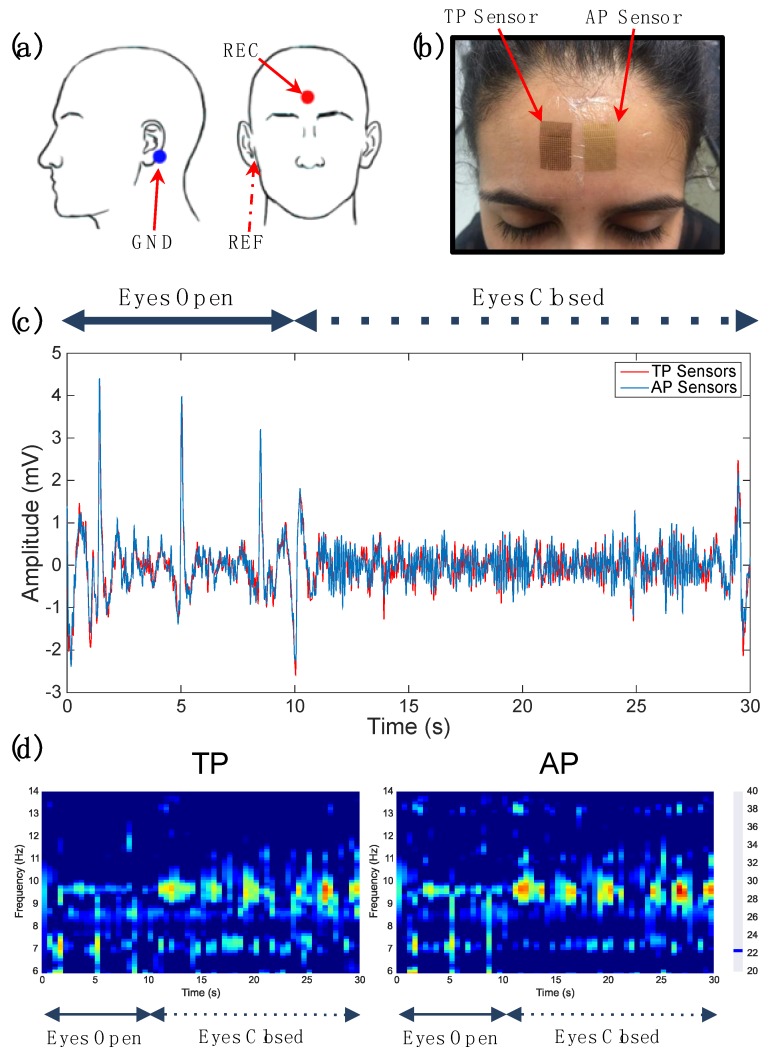
Figure 6.
Electrophysiological comparison of sensors: (a) EEG testing electrode montage; (b) sensors applied to acquisition site—TP on the left, AP on the right; (c) time−voltage plot for one epoch of data: red = TP, blue = AP; and (d) spectrographic representation of epoch: TP on the left, AP on the right. The alpha rhythm begins just after the 10 s mark for both sensors.

