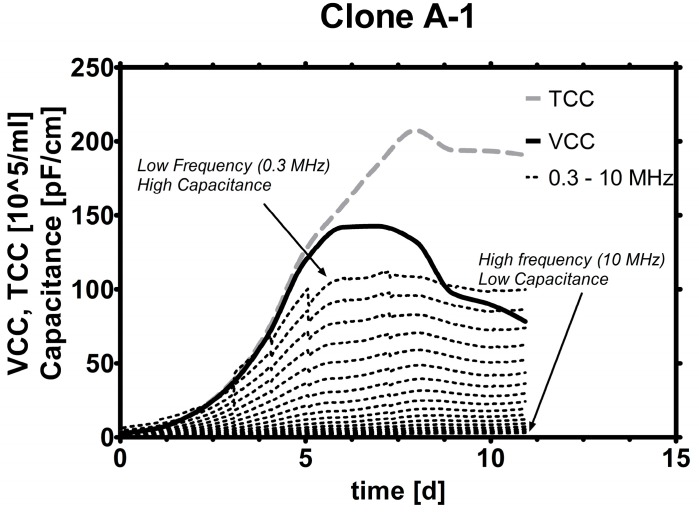
Figure 2.
Signals over time: In this plot, VCC (solid line) and TCC (dashed line) are plotted together with capacitance values induced by varying frequencies (dotted lines). The lowest frequency (top dotted line) induces the numerically highest capacitance and reaches maxima around the time when VCC and TCC reach their maxima.

