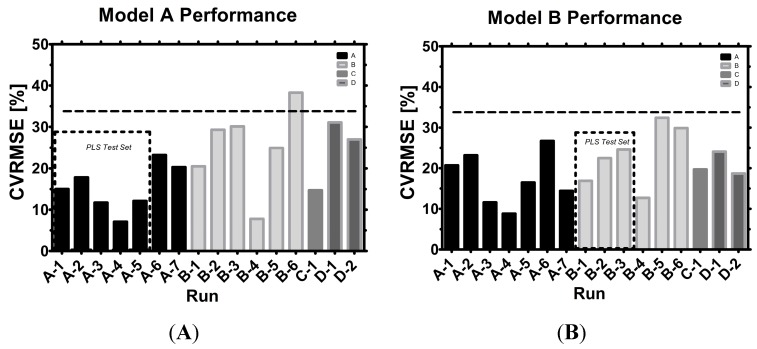
Figure 9.
Model (A) vs. model (B) performance: The test sets for the PLS models are indicated, while all other runs served as model validation sets. A horizontal dashed line indicates 33% CVRMSE. Small differences in final CVRMSE calculation are possible when minute-by-minute records of capacitance spectra are aligned with the daily offline VCC measurements by various techniques [46,47,48].

