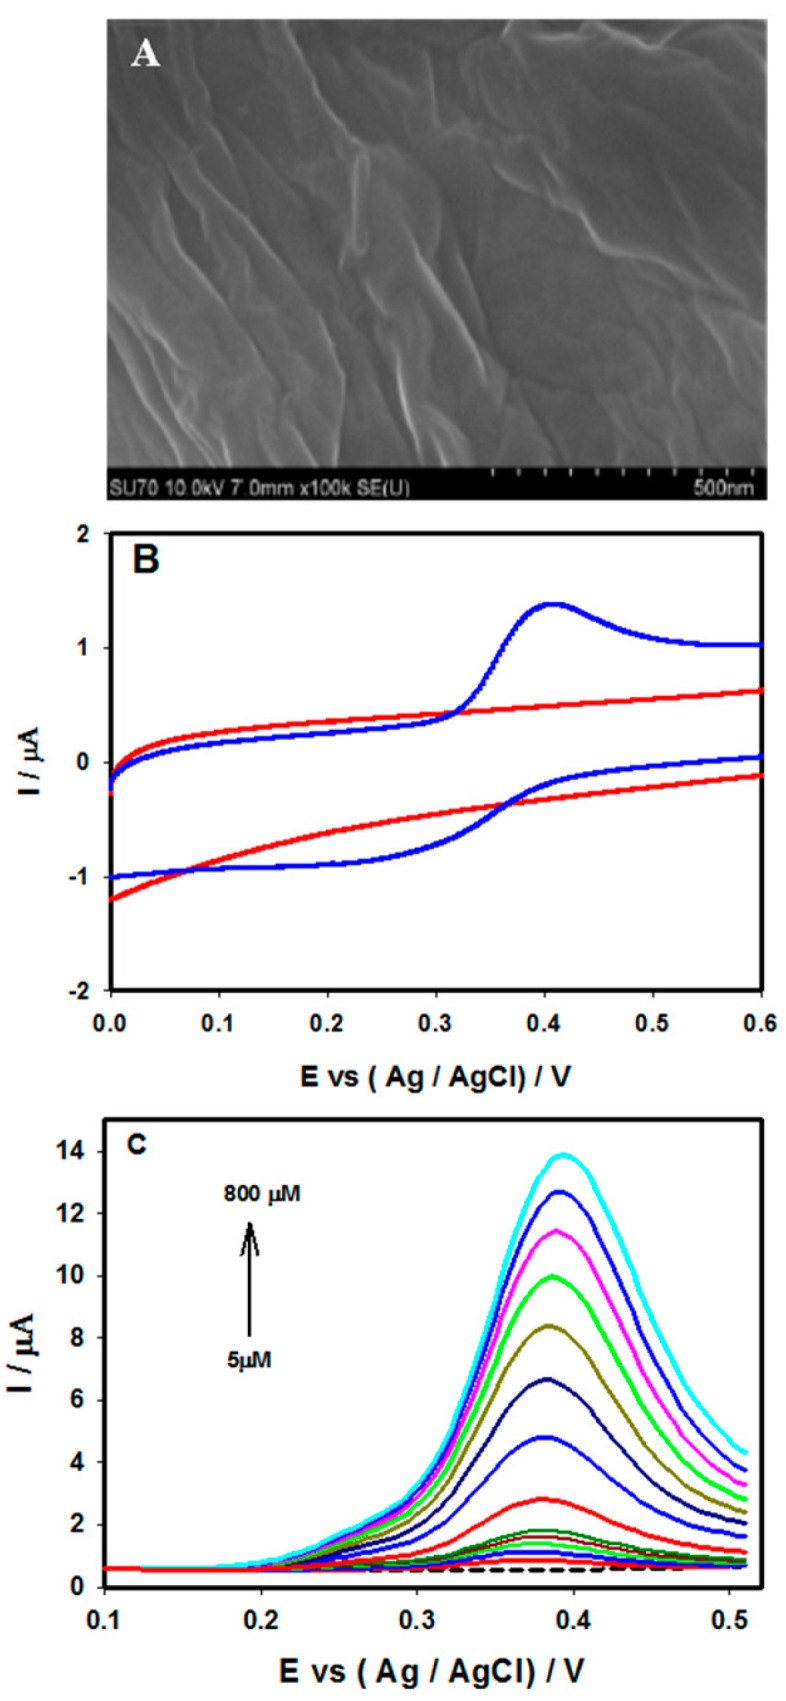
Figure 3.

(A) FE-SEM images of electrochemically reduced grapheme oxide (rGO) on the GCE surface; (B) CVs recorded at the rGO/GCE in the absence (red solid line), and presence of 50 µM acetaminophen (blue solid line) in 0.1 M PBS (pH 7.4) at a scan rate of 20 mV/s; (C) DPVs of the rGO/GCE recorded in 0.1 M PBS (pH 7.4) containing different acetaminophen concentrations (5 µM to 800 µM). Figure 3A and 3B are reproduced with permission from [26]. Copyright 2015 Elsevier.
