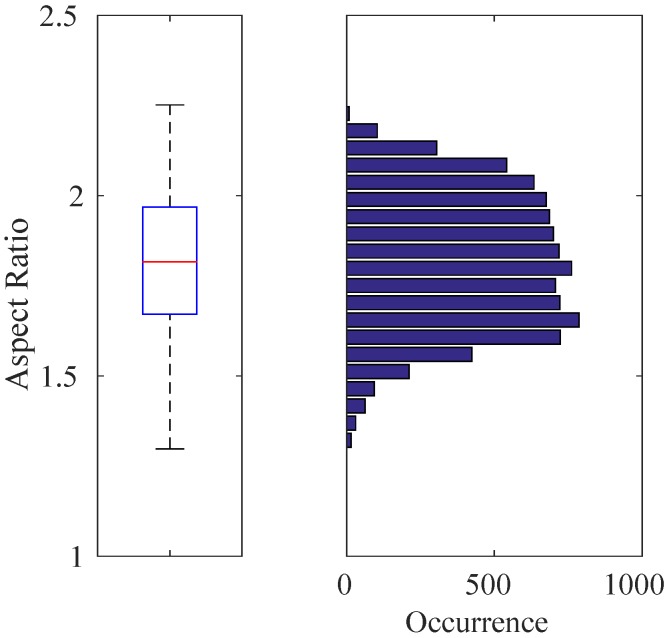
Figure 7.
Box-plot (Left) and histogram (Right) representation for the aspect ratios of 8876 quadrotor images automatically extracted from the training videos. In this figure and the subsequent box-plot figures, the top and bottom edges of the box and the line inside the box represent the first and third quartiles and the median value, respectively. The bottom and top whiskers correspond to the smallest and largest non-outlier data, respectively. The data inside the box lie within the confidence interval, while the confidence interval of the data in between the whiskers is . Here, the median value is , which defines the aspect ratio of the training images used.

