Figure 4.
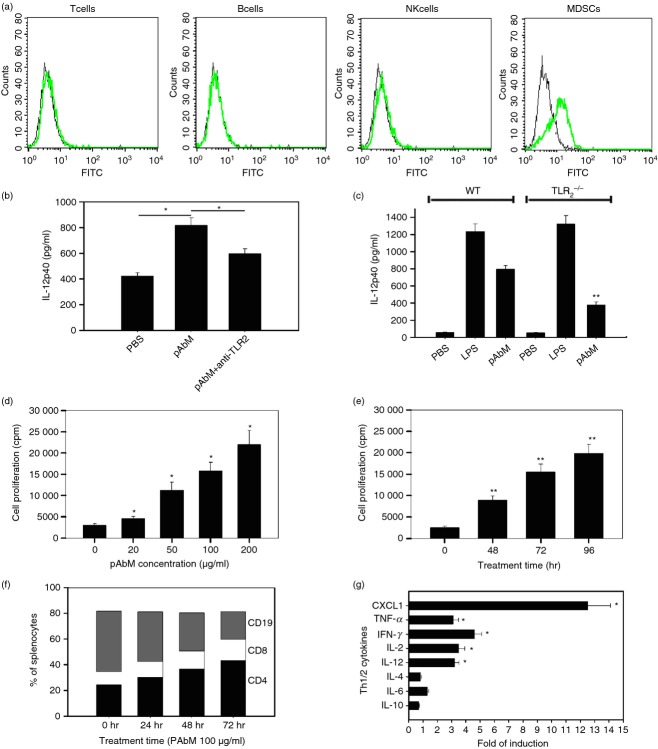
Polysaccharide Agaricus blazei Murill (pAbM) stimulates type I inflammatory response and secretion of T helper type 1 (Th1) cytokines. (a) Histograms showing the expression of Toll-like receptor 2 (TLR2) in T cells, B cells, natural killer cells, and Gr-1+ CD11b+ monocytes from mice. The filled histogram represents cells stained with anti-TLR2-FITC (green); the unfilled histogram represents cells stained with an isotype (black) control antibody. (b) Interleukin-12p40 (IL-12p40) levels (mean ± SEM) in Gr-1+ CD11b+ monocytes isolated from mice pre-treated with/or without anti-TLR2 (10 μg/µl) for 1 hr before pAbM treatment (100 μg/ml for 48 hr). *P < 0·05, analysis of variance (anova). (c) The columns represent average IL-12p40 levels (mean ± SEM) in PBS-, pAbM-, or lipopolysaccharide (LPS) -treated Gr-1+ CD11b+ monocytes from wild-type (WT) or TLR2–/– mice. **P < 0·01 compared with pAbM treatment group in WT, anova. (d) Dose of pAbM on the horizontal axis and cell proliferation in cpm on the vertical axis. *Values significantly different from control, P < 0·01, anova. The bars represent the mean ± SEM of triplicate wells in each treatment group. (e) Time course of pAbM-stimulated splenocyte proliferation. The bars represent the mean ± SEM of triplicate wells in each treatment group. **Significantly different from control, P < 0·01, anova. (f) Percentages of CD4+ (black bar), CD8+ (white bar), and CD19+ cells (grey bar) among total splenocytes at various treatment times (x-axis). (g) The columns represent the fold of induction in pAbM-treated samples over untreated controls for each cytokine by ELISA. Mean ± SEM of duplicate wells is shown in each treatment group, *P < 0·05, anova. Data are representative of at least three independent experiments (a–g).

