
Figure 3.
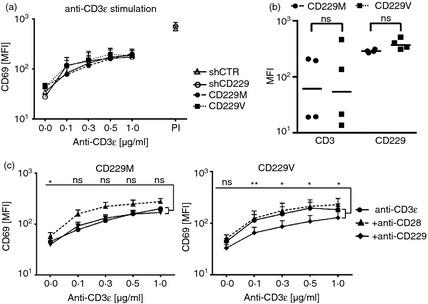
Activation through CD3 is diminished in Jurkat T cells expressing CD229 Val602 compared with CD229 Met602. (a) CD69 expression on stably transduced JC20 cells stimulated for 6 hr with plate‐bound anti‐CD3ε. PMA/Ionomycin (P/I) serves as a positive control. (b) CD3 and CD229 expression levels. Lines indicate median and statistics show P‐value of two‐tailed t‐test. (c) CD69 expression levels of stable transduced JC20 cells stimulated for 6 hr with plate‐bound anti‐CD3ε alone or in combination with soluble anti‐CD28 or anti‐CD229. Paired t‐test was used to calculate differences between anti‐CD3ε and anti‐CD229 stimulation. ns: non‐significant, *P < 0·05, **P < 0·01. Results represent mean of two experiments. In each experiment two independently generated CD229M and CD229V cell lines were analysed. Error bars in (a) and (c) represent +SEM.