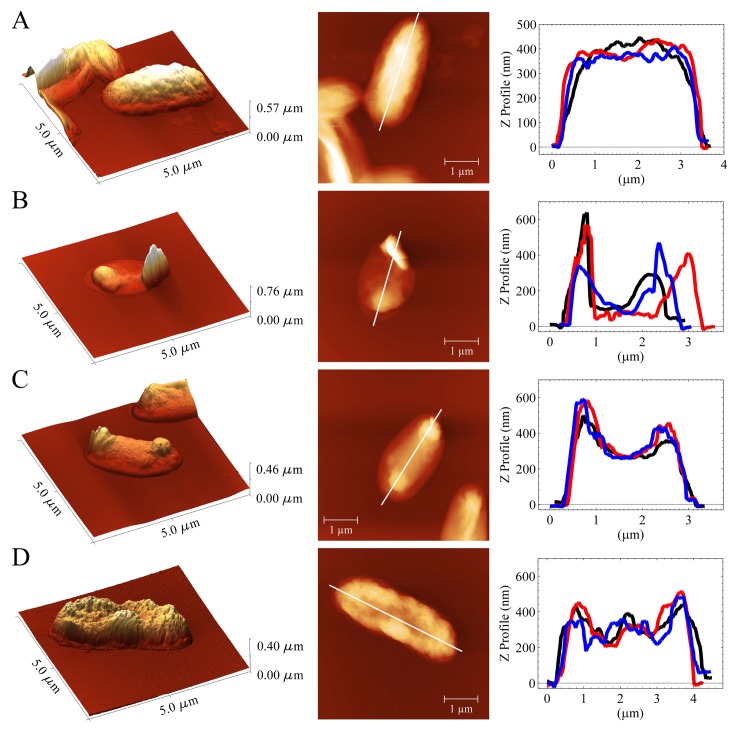
Fig 2. Representative AFM images for treated and untreated E. coli samples.
(A) Control cells, (B), (C) and (D) cells subjected to cooling process at -15, -20 and -30°C, respectively. For these cases, the container was completely filled with the sample. The first and second column correspond to 3D and 2D topographic images, respectively for only one cell. The third column shows the line profiles for three different cells. Line profiles were taken along the horizontal white line in the 2D representation. Different shades and light intensities in the images indicate different heights: the lighter shades correspond to larger heights.

