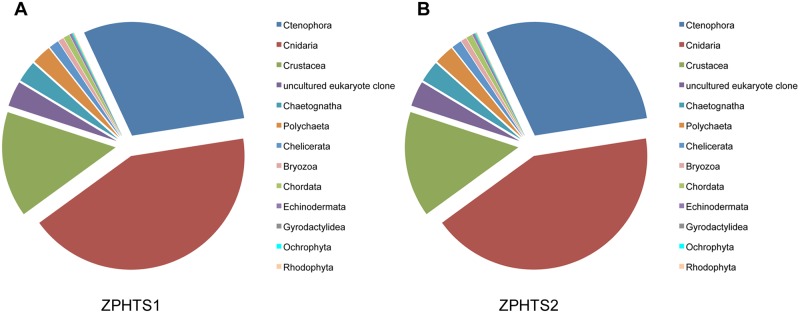
Fig 4. Pie chart illustrating the relative proportion of each phylum detected by MEGABLAST analysis (score and sequence similarity > 100 and 90%, respectively).

(A) ZPHTS aliquot 1. (B) ZPHTS aliquot 2. MEGABLAST hits to ‘uncultured eukaryote clone’ represent unclassified taxa.
