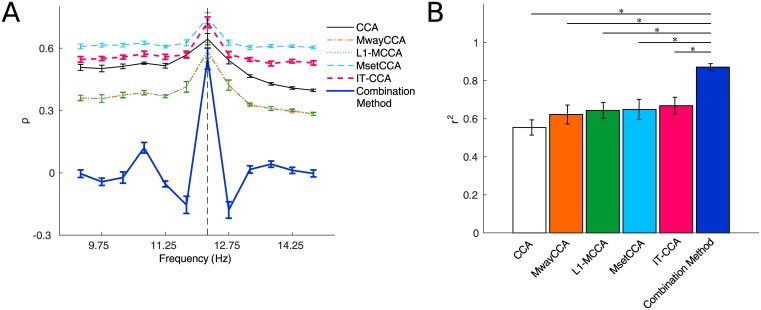
Fig 5. Examples of feature values and r-square values for each method.
(A) Averaged feature values and (B) r-square values for SSVEPs at 12.25Hz. The dotted line in (A) indicates the stimulus frequency. Error bars in each subfigure indicate standard errors. The asterisks indicate significant difference between two different methods.

