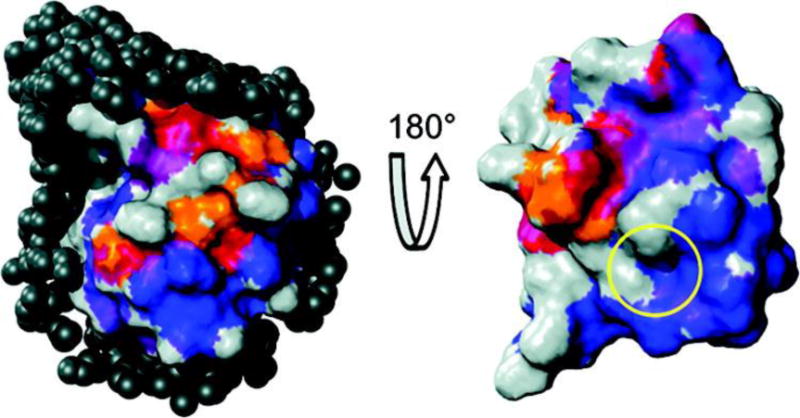
Figure 5.

Ubiquitin hydration surface and comparison to its protein-protein interaction surface, shown from two perspectives. Average σNOE/σROE ratios from −0.5 (blue) to 0 (red) are mapped to the surface, showing the regions of slower hydration dynamics (blue) and faster hydration dynamics (red). The yellow circle shows the region of ubiquitin binding interactions. Reprinted with permission from ref. 59. Copyright 2011 American Chemical Society.
