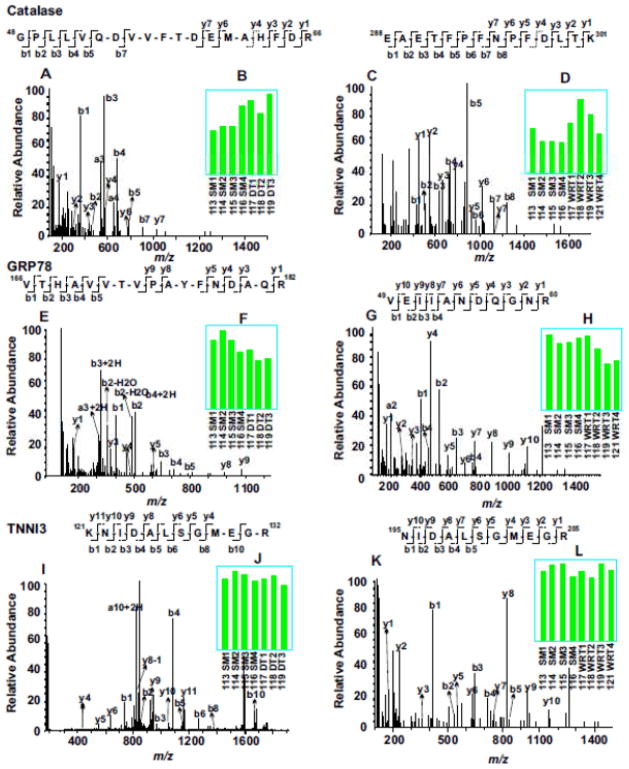
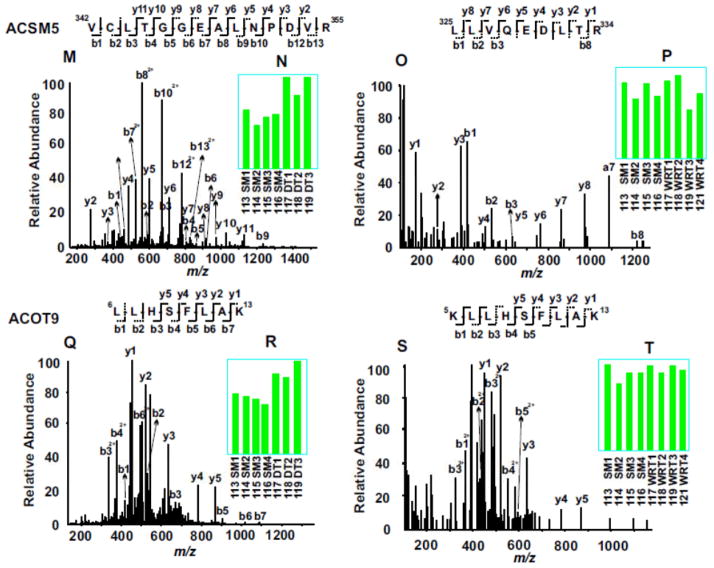
Figure 3. Example of iTRAQ analyses of woodchuck cardiac proteomic changes among SM, WRT and DT animal groups.
MS/MS spectra (A, C, E, G, I, K, M, O, Q and S) enabled confident identifications of peptide sequences based on the determination of streches of continuous series of y ions and b ions. The bar graph inserts (B, D, F, H, J, L, N, P, R and T) indicate the normalized intensities of the iTRAQ tags observed in each MS/MS spectrum. Compared to SM, catalase was up regulated in both DT and NDT groups, whereas 78 kDa glucose-regulated protein (GRP78) was down regulated in both groups. Troponin I type 3(TNNI3) did not change among all groups. Compared to SM, both acyl-coenzyme A synthetase (ACSM5) and acyl-coenzyme A thioesterase 9 (ACOT9) were up regulated only in DT groups, but not in WRT groups.


