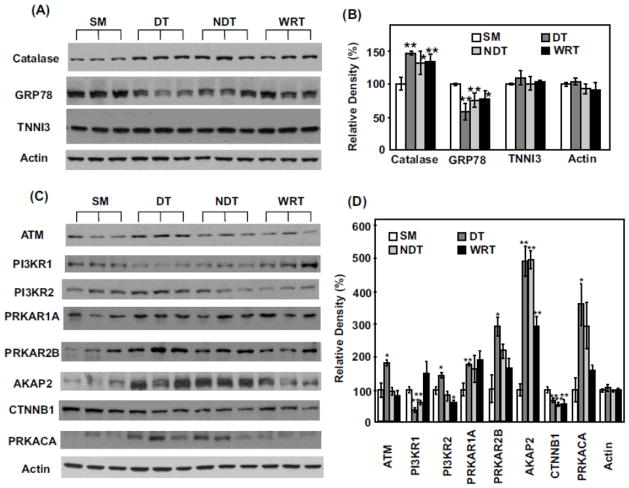
Figure 4. Western blot validation of iTRAQ proteomics changes among select proteins.
(A) Each lane represents the proteins extracted from the heart of a single distinct woodchuck. Three samples each from SM, DT, NDT and WRT groups are blotted with the antibodies against catalase, GRP78, tropoinin I (TNNI3) and actin (as the loading controls), respectively. (B) The blot densities of Catalase, GRP78, TNNI3 and actin were determined using Quantity One software (Bio-Rad). (C) Western blots and (D) blot densities determined by Quantity One for ATM, PI3KR1, PI3KR2, PRKAR1, PRKAR2B, AKAP2, CTNNB1, PRKACA and actin are shown. (D) All densities were normalized to SM1 intensities for each protein for the statistical analysis. Significant expression difference from SM was determined by Students’ t-tests. *p < 0.05 and ** p < 0.02. Data are expressed as mean (SD).

