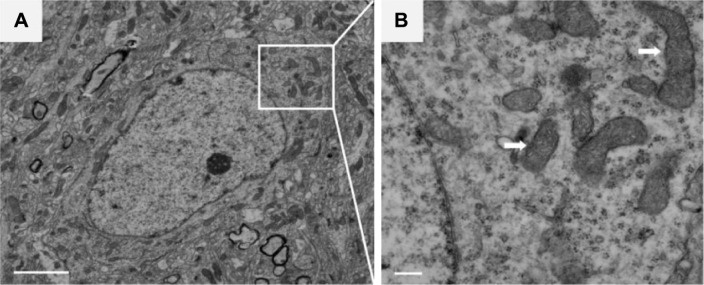
Figure 2.

Normal mitochondria ultrastructure.
Notes: (A) Neurons of sham rats that received saline injection showed normal nuclei and cytoplasm and no signs of edema, nuclear membrane breaks, or clumped tigroid chromatin. (B) Enlargement of boxed area in (A), showing healthy mitochondria without intracritical dilation or matrix changes. Arrows: mitochondria. The scale bars represent 1,000 nm and 250 nm in (A) and (B), respectively.
