Figure 4.
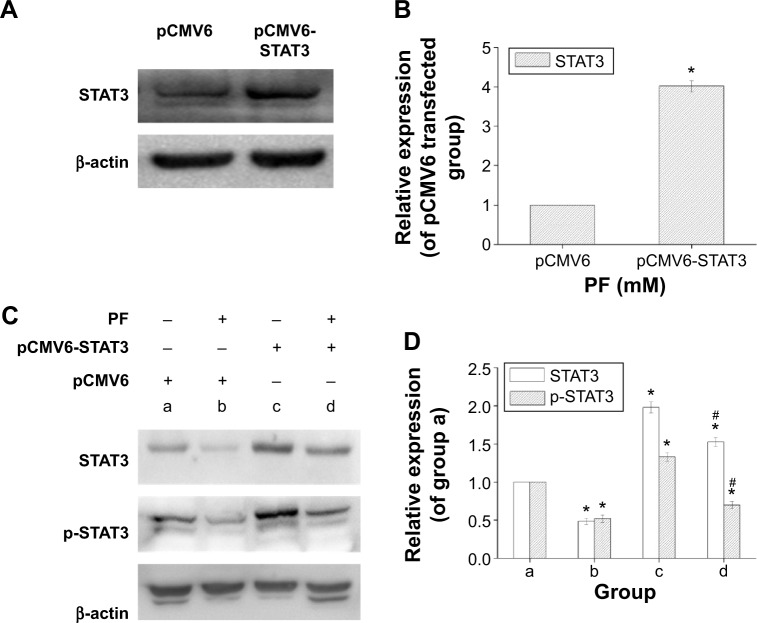
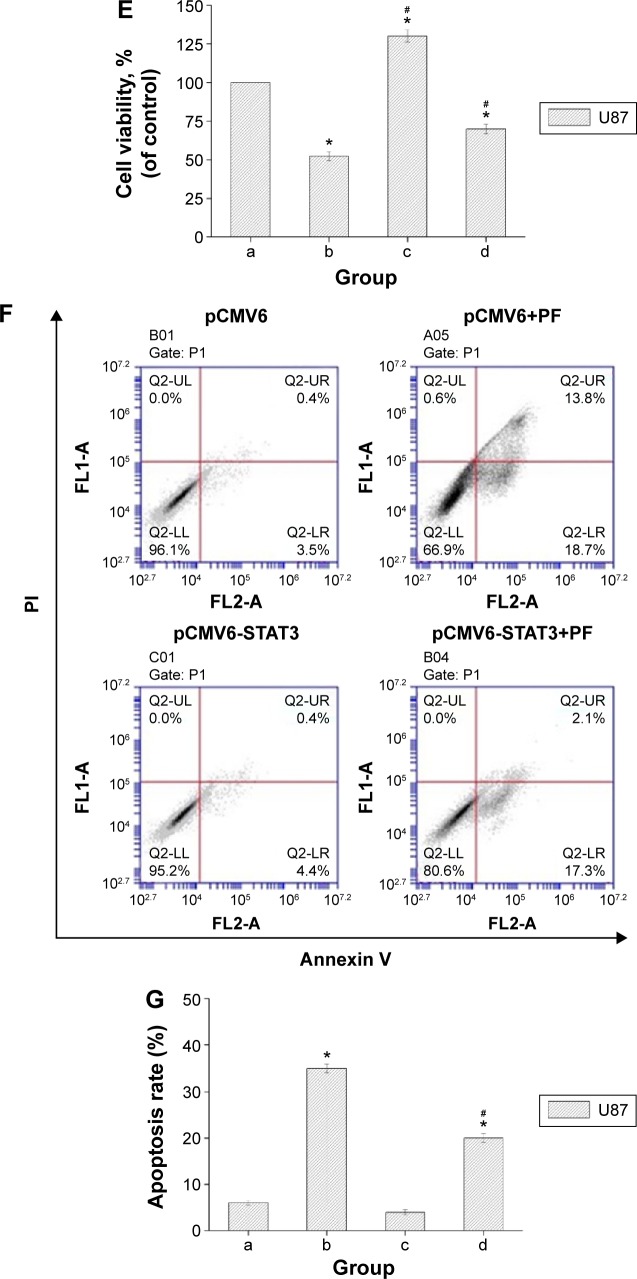
Resistance to PF-induced apoptosis in STAT3-overexpressing glioma cells.
Notes: Group definition: empty vector transfected cells with vehicle alone (a) or with PF treatment (b); STAT3-expressing plasmid transfected cells with vehicle exposure (c) or with the PF exposure (d). (A) U87 cells were transfected with STAT3-expressing plasmid or empty vector as described and confirmed by Western blot analysis. (B) Quantification of protein levels normalized to β-actin. (C) Cell extracts from each group were immunoblotted for STAT3 and p-STAT3. (D) Quantification of protein levels normalized to β-actin. (E) Cell viability was determined by MTT assay. (F–G) Cells were stained with Annexin V-FITC/PI and analyzed by flow cytometry. *P<0.05 compared with group a. #P<0.05 compared with group b. The data are representative of three separate experiments and presented as the mean ± SD; error bars indicate SD.
Abbreviations: PF, paeoniflorin; STAT3, signal transducer and activator of transcription 3; MTT, thiazolyl blue tetrazolium bromide.


