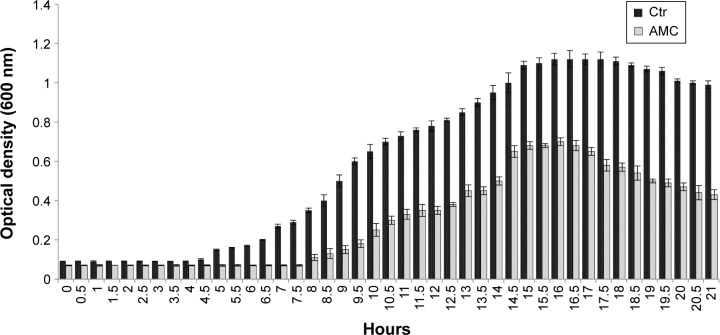
Figure 6.
Growth curves of Pseudomonas aeruginosa, Escherichia coli, and Enterococcus faecalis incubated with 2.5 µM AMC (gray bar) and in Ctr (black bar).
Notes: Representative results obtained for P. aeruginosa. Bacterial growth was followed from the beginning of growth until OD600 reached 1.2 after 21 hours of incubation. Error bars show the standard deviations from two independent experiments.
Abbreviations: AMC, antimicrobial cyclic peptide; Ctr, control condition; OD, optical density.

