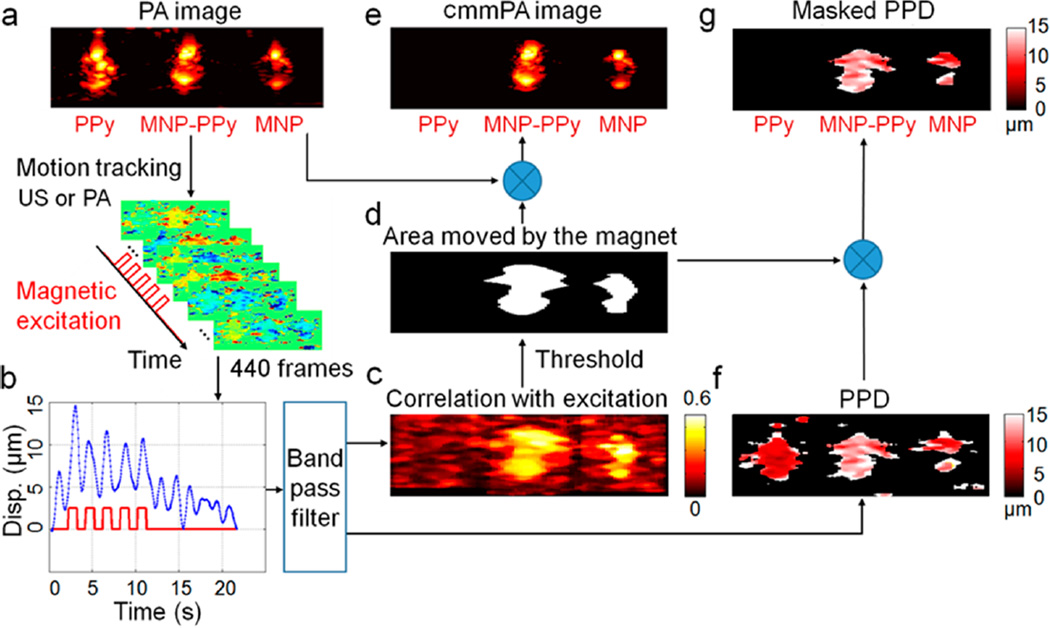
Figure 6.
Data processing of cyclic mmPA. A PVA phantom with three 2 mm diameter inclusions, in which the one on the left contains PPy nanoparticles with absorption comparable to 5 nM MNP–PPy hybrid nanoparticles placed in the center of phantom, and the third inclusion on the right contains 5 nM MNPs. (a) A conventional photoacoustic image of this phantom presented on a logarithmic scale over a 40 dB display range. (b) A representative displacement of MNP–PPy inclusion during 5-cycle square wave magnetic excitation with a frequency of 0.5 Hz. (c) Correlation with excitation map (CEM) utilized to produce photoacoustic image background suppression with a threshold of 0.5. (d) Mask produced by thresholding the CEM with 0.5 and used to identify MNPs. (e) The cmmPA images produced by multiplying the threshold mask from (a), in which the PPy inclusion is almost completely suppressed. (f) Peak to peak displacement images before and (g) after background suppression with the threshold mask.

