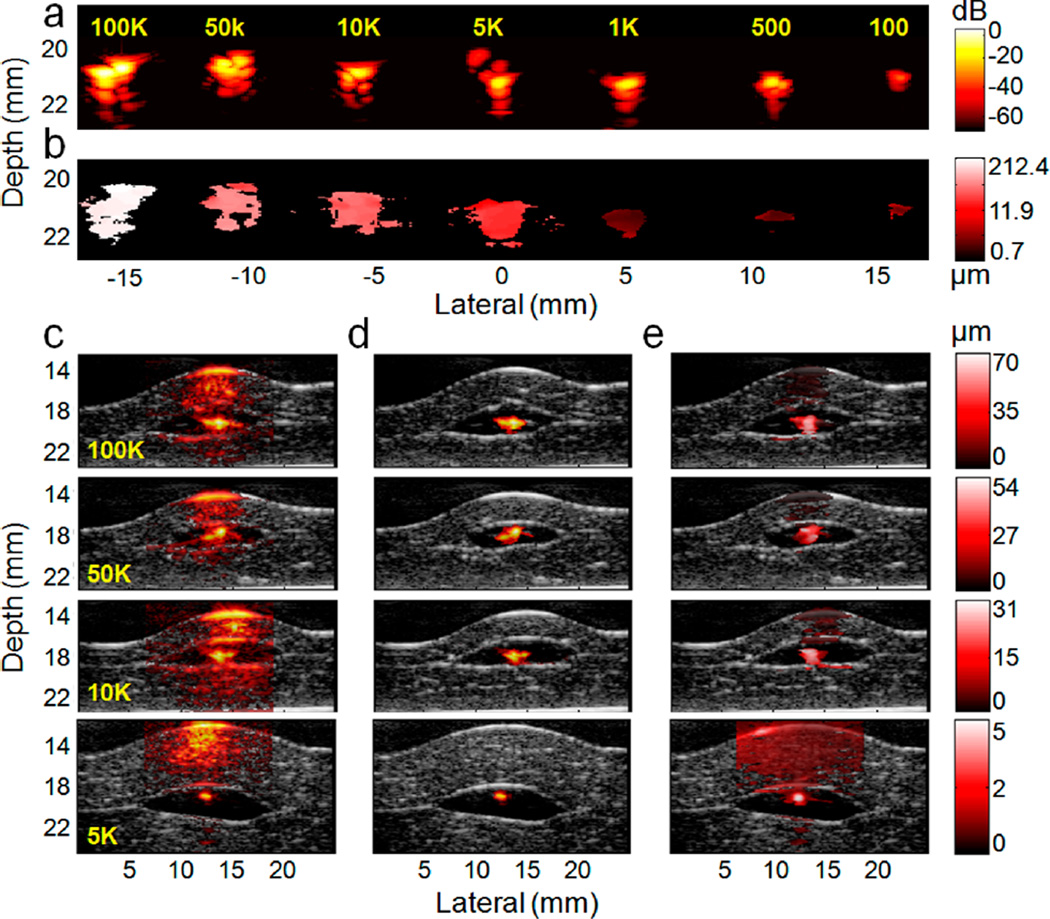
Figure 7.
Sensitivity and selectivity of cmmPA imaging for cancer cell detection through photoacoustic speckle tracking (PAST, 0.5 Hz magnetic excitation). (a) Photoacoustic images of the phantom embedded with seven cell pellets (cell number from 100 to 100k) on a logarithmic scale over a 70 dB display range. (b) Peak to peak displacement image over a display range of 0.7–212.4 µm. Magnetic displacement decreases with smaller tumor size. (c–e) Ex vivo photoacoustic and cmmPA images of cell pellets (cell number from 5k to 100k) embedded in the middle of two porcine liver slices (producing strong background signals). (c) Photoacoustic and (d) cmmPA images though PAST (hot colors) superimposed on ultrasound images (gray colors) on a logarithmic scale over a normalized dB display range. The black region around the center hot spot (cell pellet) corresponds to the thin acoustically and optically transparent PVA layer used to encapsulate the cell pellets to avoid cell diffusion in tissues. (e) Displacement images of cell pellets over various displacement ranges.

