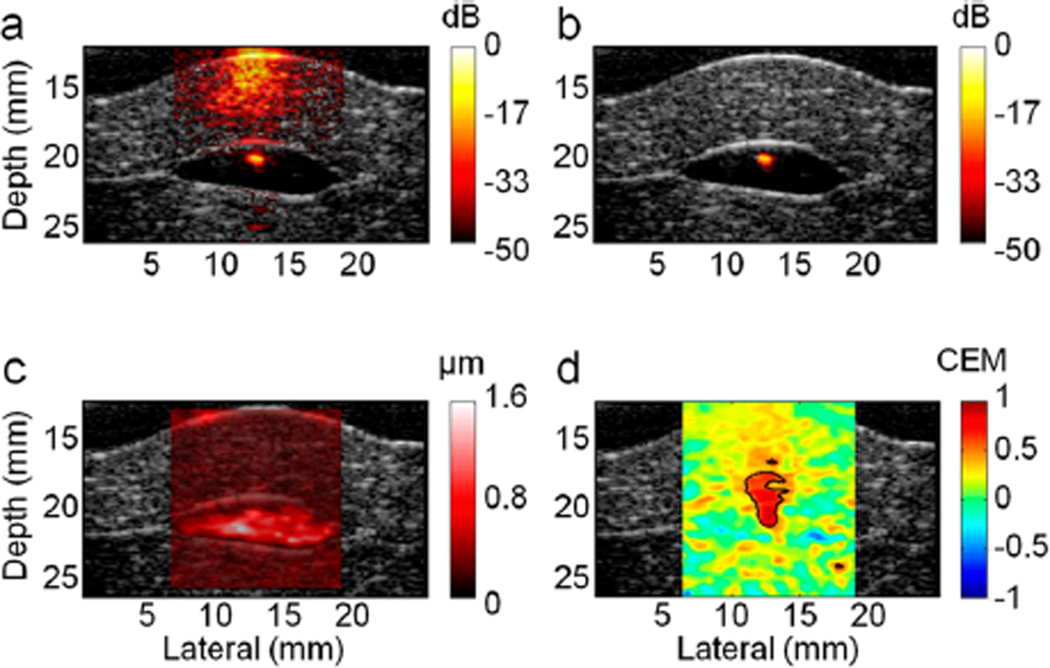
Figure 8.
Sensitivity and selectivity of ex vivo cmmPA imaging using US speckle tracking (USST). (a) Photoacoustic image of the cell pellet containing 5k cancer cells overlaid on ultrasound images (gray colors) on a logarithmic scale over a 50 dB display range. (b) cmmPA image obtained with USST (10 Hz magnetic excitation). (c) Peak to peak displacement image over a display range of 0–1.6 µm. (d) Correlation with an excitation map utilized to produce photoacoustic image background suppression with a threshold of 05.

