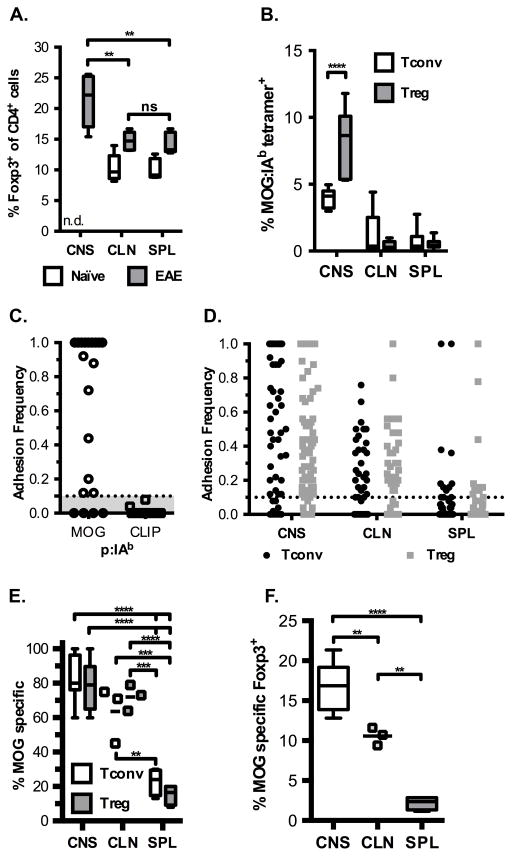
Figure 1.
Enrichment of MOG-specific Foxp3+ Tregs in the CNS during EAE. (A) Frequency of Foxp3-expressing CD4+ cells in various organs from naïve mice (open box plots) and at peak disease (filled box plots) (CNS – central nervous system, CLN – cervical lymph node, SPL – spleen). Data are from five experiments, one-way repeated measures ANOVA ** p <0.01 (CNS vs. CLN p = 0.0070, CNS vs. SPL p = 0.0051), ns – not significant, n.d. – not determined. (B) Tetramer staining frequencies by organ during peak EAE for Tconv and Tregs, with representative FACS plots shown in Supplemental Figure 1. Data from at least 5 independent experiments, two-way ANOVA repeated measures **** p < 0.0001. (C) Representative adhesion frequencies for individual CNS cells for MOG:IAb and hCLIP:IAb coated RBCs. All cells were tested for binding to both antigens and data are from two independent experiments, with ten cells per each experiment tested. (D) MOG:IAb adhesion frequencies for T cells isolated from indicated organs at peak EAE, where each dot represents an individual cell tested. Number of cells tested: CNS Tconv – 65; CNS Treg – 107; CLN Tconv – 41; CLN Treg – 40; SPL Tconv – 55; SPL Treg – 55. (E) Overall frequency of cells that recognize MOG from the indicated organs. (D-E) Data from eight, three, and four experiments for CNS, CLN and SPL respectively, (E) two-way ANOVA comparing means for indicated cell-type between tissues, **** p < 0.0001 (CNS Tconv vs SPL Treg, CNS Tconv vs SPL Tconv, CNS Treg vs SPL Treg, CNS Treg vs SPL Tconv, CLN Treg vs SPL Treg), *** p < 0.001 (CLN Tconv vs SPL Treg p = 0.0004 and CLN Treg vs SPL Treg p = 0.0003), ** CLN Tconv vs SPL Tconv p = 0.0025, ns (Tconv: CNS vs. CLN; Treg: CNS vs. CLN). (F) The frequency of MOG-specific Tregs as a percent of total CD4+ cells was determined by multiplying the %MOG-specific by the average frequency of Foxp3+ cells in each location, one-way ANOVA, **** p < 0.0001 (CNS vs. SPL), ** p < 0.01 (CNS vs. CLN p = 0.0078, CLN vs. SPL p = 0.0020). Box plots with min to max whiskers for all panels except C and D where each dot represents an individual cell and for CLN in E and F where each dot represents an individual experiment because n = 3.

