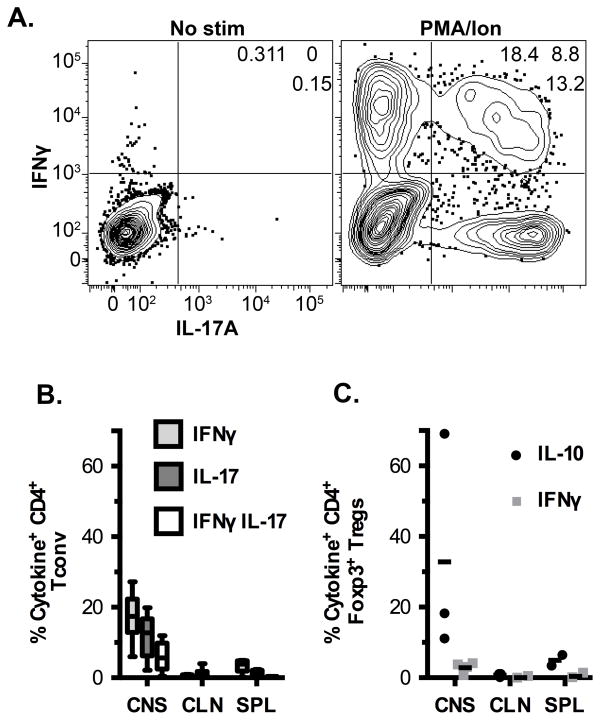
Figure 2.
Production of cytokines by Tconv and Treg cells during EAE. (A) Representative flow plots showing IL-17A and IFNγ production by CNS Tconv cells. (B) Frequencies of single and double cytokine producing Tconv cells in various organs at peak EAE upon stimulation with PMA and ionomycin. Data are from at least 5 independent experiments. (C) Percent of Tregs producing IL-10 or IFNγ in the various organs in response to PMA/Ionomycin stimulation. Data are from three independent experiments, except for SPL which is from two experiments.

