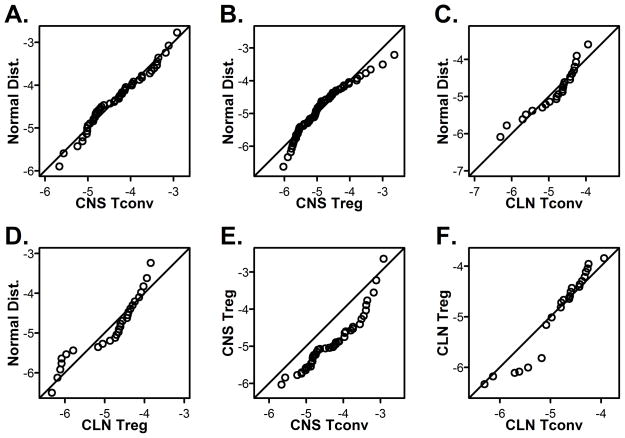
Figure 4.
CNS Tconv cells are normally distributed unlike CNS Tregs and cells in periphery. (A–D) Q-Q plots were generated for (A) CNS Tconv, (B) CNS Treg, (C) CLN Tconv and (D) CLN Treg using the data from Figure 3A. Comparisons of the distributions of Tconv to Treg in the (E) CNS and (F) CLN were done by Q-Q plots.

