Figure 5.
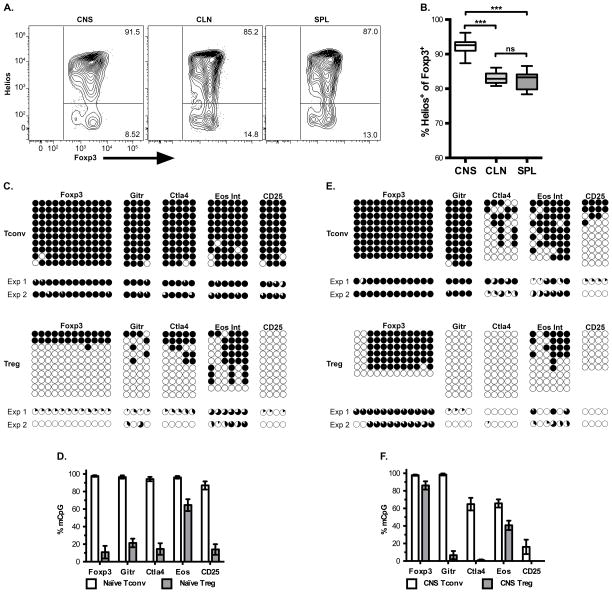
CNS Tregs are of thymic origin. (A) Representative flow plot for Helios expression by Treg cells, related to Supplemental Figure 2 showing Helios by Foxp3 expression for CD4+ T cells. (B) Average frequency with SEM of Helios expression in Foxp3+ CD4+ cells in various organs at peak disease, Data from seven independent experiments. One-way repeated ANOVA *** p < 0.001 (CNS vs. CLN p = 0.0003, CNS vs. SPL p = 0.0002). (C–F) The methylation status within each gene region was determined for the tTreg-Me signature genes for CD4+ Tconv and Treg from (C, D) splenocytes of naïve mice or (E, F) CNS-infiltrating cells from EAE mice. In panels C and E, each column represents an individual CpG within the region of interest and each row is an individual clone sequenced, where a filled black circle is a methylated CpG and an open circle is a demethylated CpG. Representative data from a single experiment is shown, and below is pie charts to indicate the methylation frequency at that CpG within each of the two experiments. Panels D and F are the total level of methylation for the CpGs for all clones and CpGs across that gene region. Data are from two independent experiments, with at least nine clones sequenced per gene per experiment, except for d21 CNS Treg Foxp3 and CD25 which had at least 4 clones sequenced.

