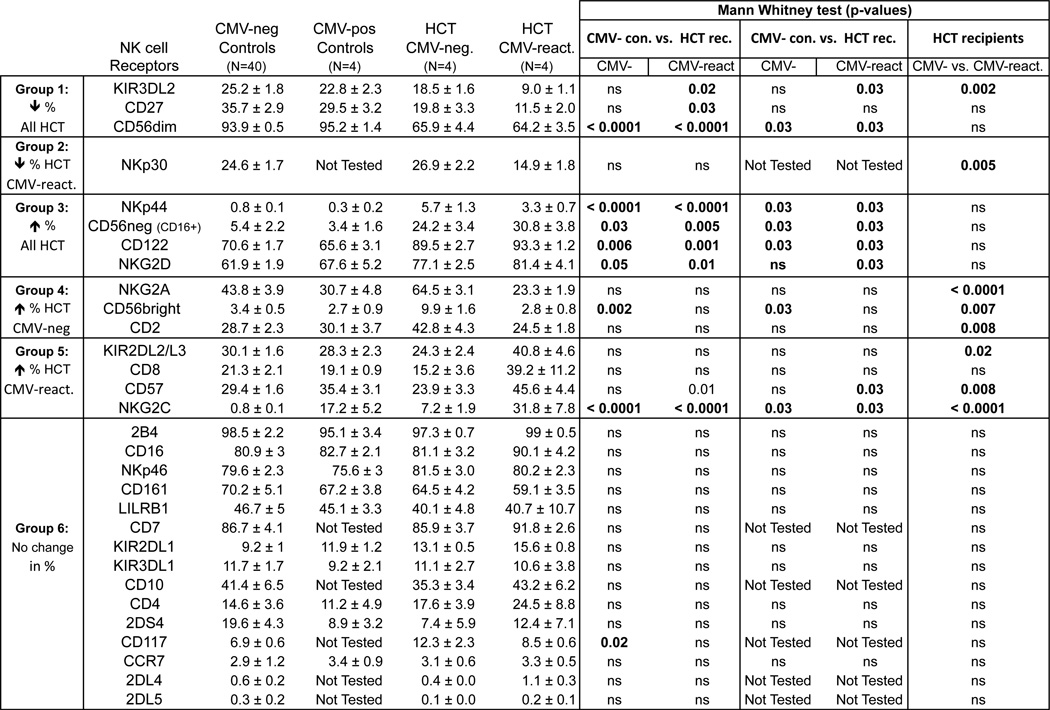
Figure 3. Comparing NK cell receptor expression on NK cells between controls and HCT recipients.
NK cells were defined by a gating strategy described in Fig. S1. Six patterns of perturbations in receptor expression between healthy controls and HCT recipients were observed and are labeled Group 1–6. CMV-neg Controls, Healthy CMV seronegative individuals; CMV-pos Controls, Healthy CMV seropositive individuals; CMV-negative, HCT recipients that are CMV seronegative; CMV-positive, HCT recipients seropositive with reactivated CMV; ns, not significant. Data represent means (± SE).

