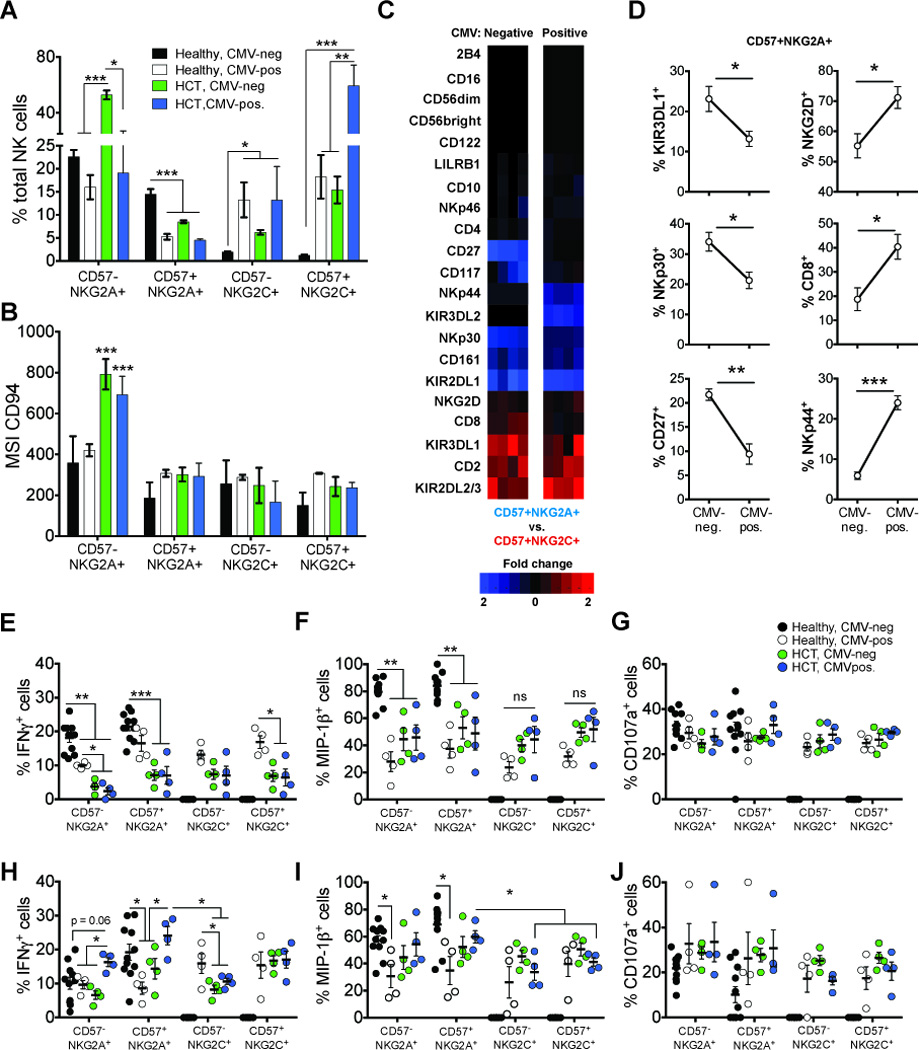
Figure 4. Comparison of phenotypes and function of adaptive CD57+NKG2C+ and CD57+NKG2A+ NK cells.

(A) The frequency of total NK cells that are CD57−NKG2A+, CD57+NKG2A+, CD57−NKG2C+ and CD57+NKG2C+ and (B) mean signal intensity (MSI) of CD94 expression within each population from CMV-negative controls (black bars; N=40), CMV-positive controls (white bars; N=4), CMV-negative (green bars; N=4) and CMV-positive (blue bars; N=4) HCT recipients. (C) Heat maps comparing fold change in frequency of each receptor between CD57+NKG2A+ and CD57+NKG2C+ NK cells in CMV-negative (left column) and CMV-positive (right column) HCT recipients. Shaded boxes represent increased fold change differences biased towards CD57+NKG2C+ (red) and CD57+NKG2A+ (blue). (D) Frequencies of CD57+NKG2A+ NK cells expressing receptors shown to decrease (left column) or increase (right column) in CMV-positive HCT recipients compared to CMV-negative HCT recipients. (E–J) PBMC from CMV-negative (black circles) and CMV-positive (white circles) controls and from CMV-negative (green circles) and CMV- positive (blue circles) HCT recipients were challenged with (E–G) K562 target cells or with (H–J) Raji cells pre-treated with anti-human CD20 antibody. Graphs show the frequencies of NK cell subsets positive for intracellular IFN-γ (E and H), MIP-1β (F and I) and CD107a (G and J). The bars in the dot plots represent mean (± SE). The p values are derived from unpaired Mann Whitney tests. *p<0.05, **p<0.005, ***p<0.0001.
