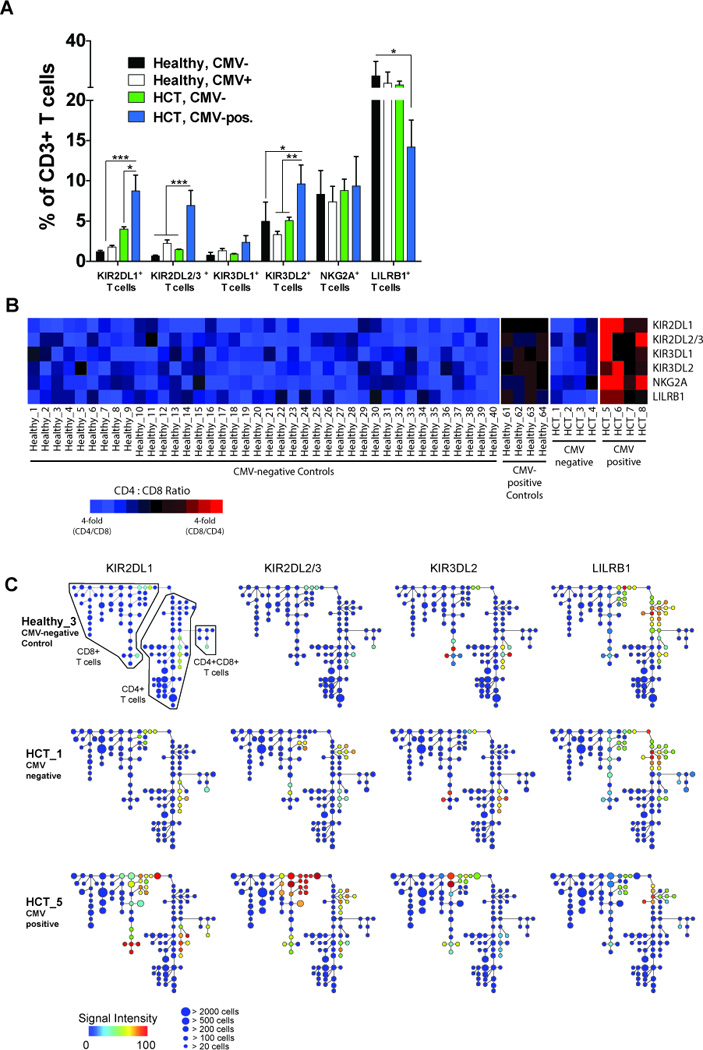
Figure 5. Expression of inhibitory KIR and NKG2A across T cell subsets.

(A) The frequency of CD3+ T cells expressing KIR2DL1, KIR2DL2/3, KIR3DL1, KIR3DL2, NKG2A or LILRB1 in CMV-negative (black bars; N=40) and CMV-positive (white bars; N=4) controls and in CMV-negative (green bars; N=4) and CMV-positive (blue bars; N=4) HCT recipients. Data represent means (± SE). The p values are derived from unpaired Mann Whitney tests. *p<0.05, **p<0.005, ***p<0.0001. (B) Heat map summarizing the proportion of KIR+, NKG2A+ and LILRB1+ T cells that are skewed towards CD4 (blue boxes), CD8 (red bars) or balanced between CD4 and CD8 (black boxes) T cells in CMV-negative and seropositive controls and in CMV-negative and CMV-positive HCT recipients. (C) Spanning-tree Progression Analysis of Density-normalized Events (SPADE) for 3 representative samples (CMV-negative control, CMV-negative and CMV-positive HCT recipients) evaluating distribution of KIR2DL1 (left column), KIR2DL2/3 (second column from left), KIR3DL2 (third column from left) and LILRB1 (right column) expression on CD4, CD8 and CD4CD8 T cells. Node color represents signal intensity and size represents frequency. A SPADE analysis evaluating distribution of all other measured receptors is shown in Figs. S2 and S3.
