
Figure 6. Comparing the functions between Null CD56+ T cells and CD56+ T cells expressing inhibitory NK receptors.
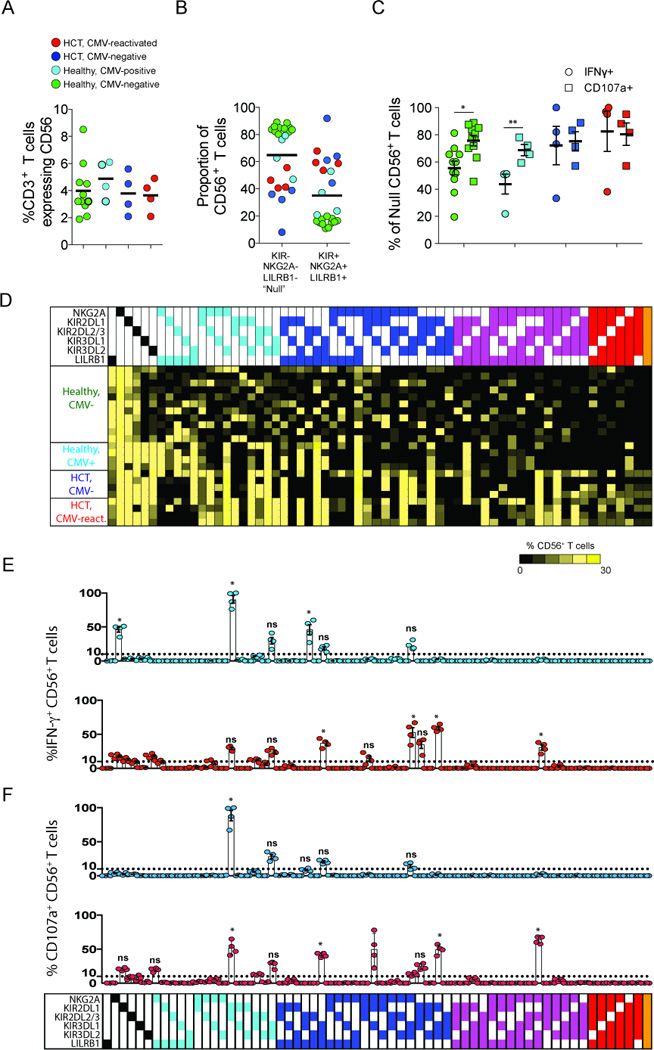
PBMC from CMV-negative controls (green), CMV-seropositive controls (light blue), CMV-negative (dark blue) and CMV-positive (red) HCT recipients were incubated with K562 cells. (A) Comparing the frequency of CD3 T cells expressing CD56 in controls and in HCT recipients. (B) Comparing the proportion of CD56+ T cells that stain positive or negative for inhibitory KIR, NKG2A or LILRB1 (Null). (C) Comparing the frequency of Null CD3 T cells producing IFN-γ (circles) or expressing CD107a (squares) in controls and in HCT recipients. (D) Heatmap summary for Boolean gating analysis of inhibitory KIR, NKG2A and LILRB1 expression on CD56+ T cells resulting in sixty-four possible subsets. Each subset is grouped and color-coded according to the number of inhibitory receptors expressed. The color of each box ranges from black to yellow (range: 0–30%) according to the scale bar beneath the heatmap. (E and F) The frequency of each CD56+ T cell subset producing IFN-γ (E) and expressing CD107a (F) in CMV-negative (light blue circles) and CMV-positive (red circles) HCT recipients. The bars underneath the dot plots represent mean (± SE). The p values are derived from unpaired Mann Whitney tests. *p<0.05, **p<0.005.