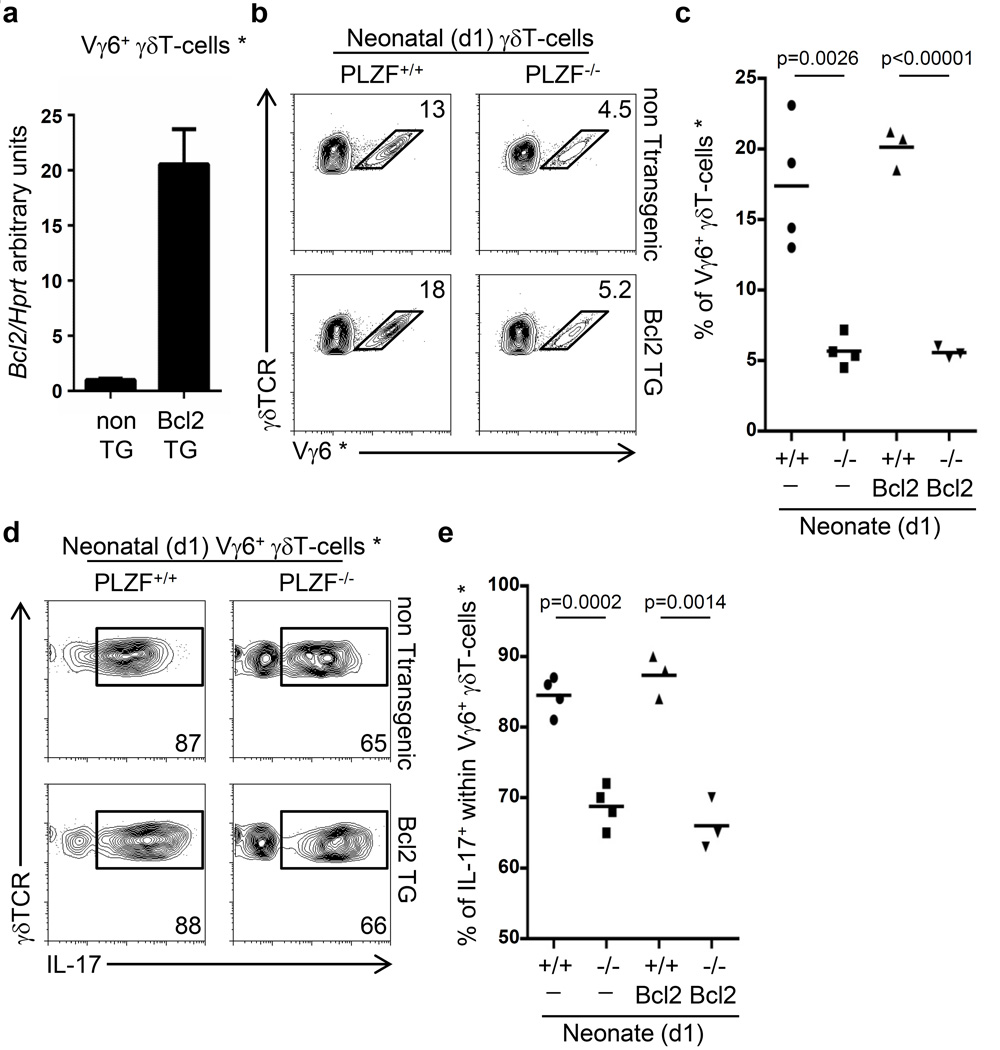
Figure 4. Transgenic Bcl2 expression fails to rescue the effector maturation of PLZF-deficient Vγ6+γδT-cells.
a) RT-PCR from wild type and Bcl2-TG neonatal Vγ6+γδT-cells. b) FACs analysis on γδT-cells from PLZF-wild type or PLZF-deficient neonatal thymus that are also transgenic for Bcl2 (Bcl2 TG). The numbers indicate the percentage of cells within the gate. c) Gram plot indicating the percentage of Vγ6+ γδT-cells represented in panel (b). d) FACs analysis for intracellular IL-17 staining after PMA plus Ionomycin stimulation of Vγ6+γδT-cells indicated in panel (b). Numbers represent the percentage of events within the gate. e) Gram plot of the percentage of IL-17+ Vγ6+γδT-cells as represented in panel (d). Data is representative of two independent experiments. Each dot in the gram plots represents data from a neonate and horizontal lines represent the mean value. p values corresponding to the significance using T-test are shown. * Vγ6+ cells are identified as GL3+2C11+Vγ5−17D1+ cells.

