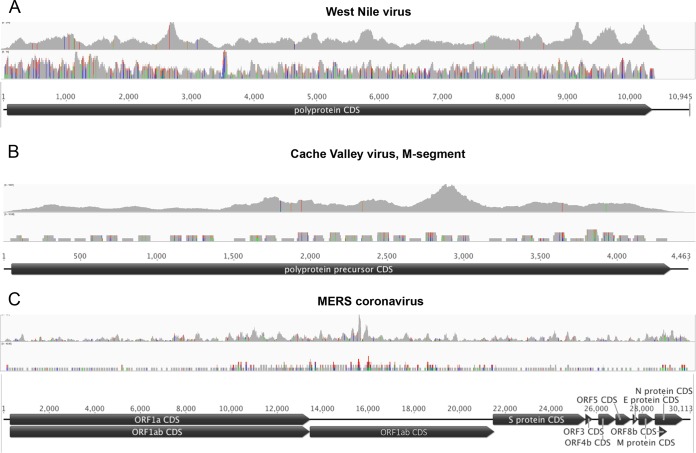
FIG 3 .
Read coverage versus probe coverage of VirCapSeq-VERT for West Nile virus (A), Cache Valley virus (B), and MERS coronavirus (C). Virus genomes are represented by horizontal black lines and coding sequence by black pointed boxes. The top graph in each panel indicates the read coverage obtained by VirCapSeq-VERT; probe coverage is shown below. Colored lines indicate mismatch to the reference used for alignment (green, A; red, T; blue, C; orange, G). Line heights indicate the frequency of the mismatched bases.

