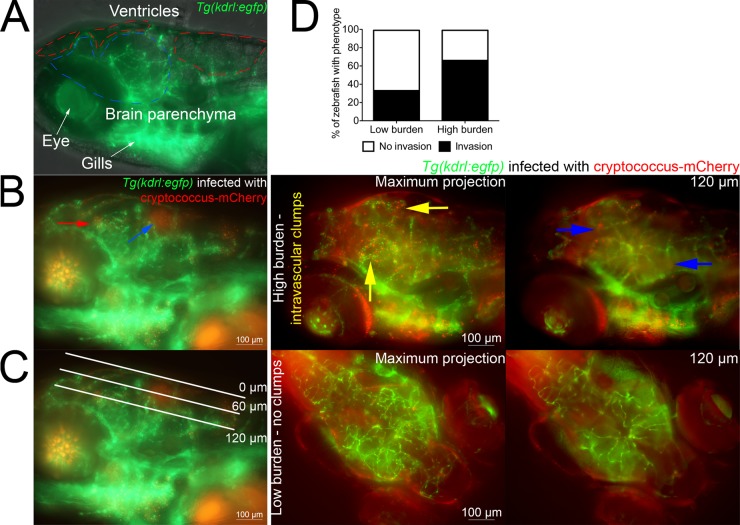
FIG 4 .
Assessment of cryptococcal brain tissue invasion in zebrafish larvae. (A) Lateral z axis projection of the head of an uninfected 6-dpf Tg(kdrl:EGFP)s843 larva (blood vessels in green). The boundaries of the ventricles and brain parenchyma are marked by red and blue dashed lines, respectively. (B) Lateral z-axis projection of the head of a 4-dpi Tg(kdrl:EGFP)s843 larva (blood vessels in green and Cryptococcus in red). The blue arrow indicates C. neoformans colonization of hindbrain ventricle, and the red arrow indicates C. neoformans in the brain parenchyma. (C) Lateral z-axis projection of the head of a 4-dpi Tg(kdrl:EGFP)s843 larva (blood vessels in green and Cryptococcus in red). White lines indicate the approximate depth of optical sections used throughout Fig. 4 and 6. The 0-µm edge is stereotypically set at the dorsal-most blood vessel, and a 60-µm depth stereotypically traverses ventricle spaces dorsal to the brain tissue, which is reached at around 100 to 120 µm in depth. (D) Comparison of C. neoformans brain tissue invasion rates between larvae with sporadic colonization of cranial vasculature (low burden) and larvae with clumps of yeast cells within cranial vasculature (high burden). In example images, blood vessels are in green and Cryptococcus is in red. Yellow arrows in example images indicate clumps of intravascular yeast, and blue arrows indicate extravasated yeast in the brain tissue.

