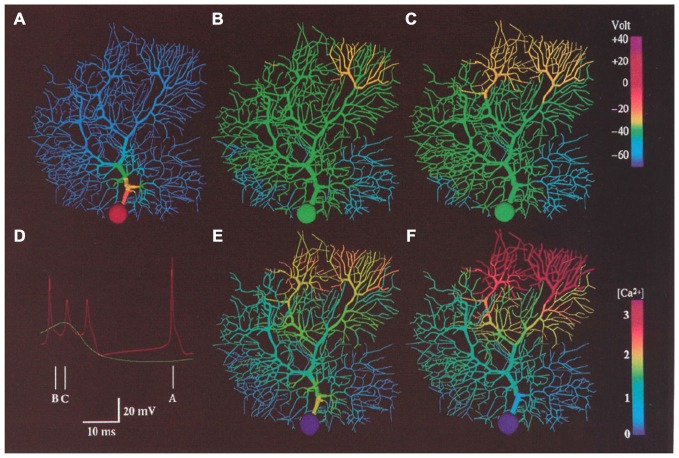
Figure 12.
False color representation of membrane potential and Ca2+ concentration during a 2.0 nA current injection in the soma of the modeled Purkinje cell. Simulated membrane potential is shown during a somatic action potential (A), at the beginning of a dendritic spike (B) and 1.6 ms later (C). (D) shows predicted somatic (red) and dendritic (Green) membrane potential at the times indicated. (E,F) indicated submembrane Ca2+ concentration at the same time as (B,C) respectively. Reproduced with permission from De Schutter and Bower (1994b).

