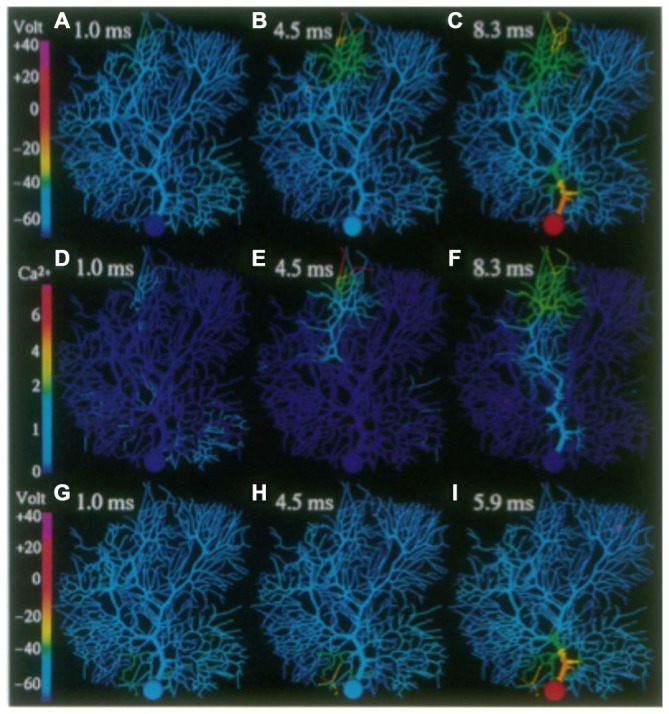
Figure 13.

False color images of the response of the R-DB Model to a synchronous synaptic input on a distal (A–F) and proximal (G-I) branchlet. Membrane potential in (A–C) and (G–I). (D–F) Submembrane Ca2+ concentrations corresponding to activity in (A–C). Reproduced with permission from De Schutter and Bower (1994c).
