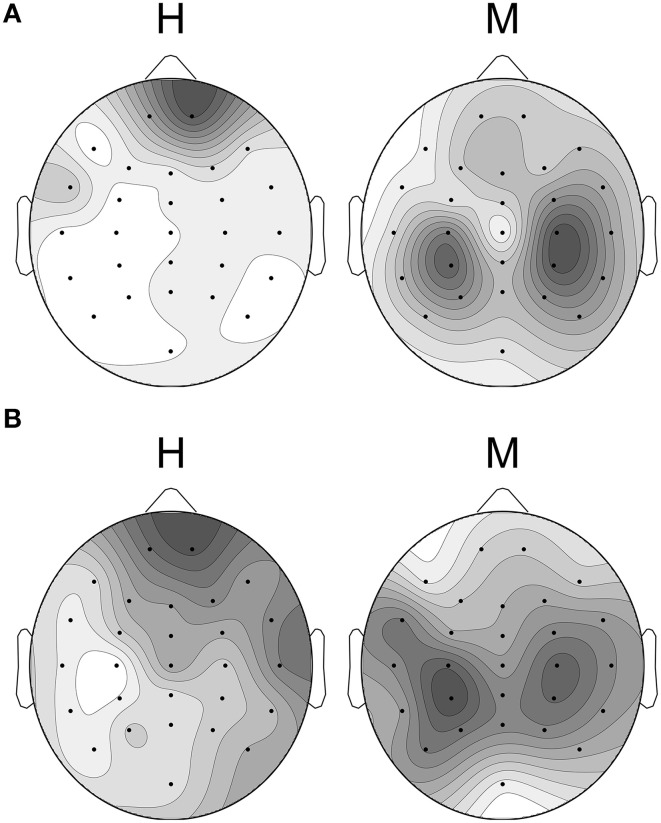
Figure 7.
The most prominent Common Spatial Patterns (CSPs) extracted from the classification model and from a combination of subjects. Black dots mark EEG channels. The darker the gray value in the plot is, the more prominent is the ratio of variance in the respective channels. The topographic map on the left shows the pattern for the happy condition, whereas the pattern of the motor condition is shown on the right. (A) The CSPs extracted from the concatenated data of the 16 well-performing subjects were used to create the classification model. (B) Individual CSPs averaged over all the subjects with a mean classification accuracy of 75% or more. Black dots mark EEG channels.

