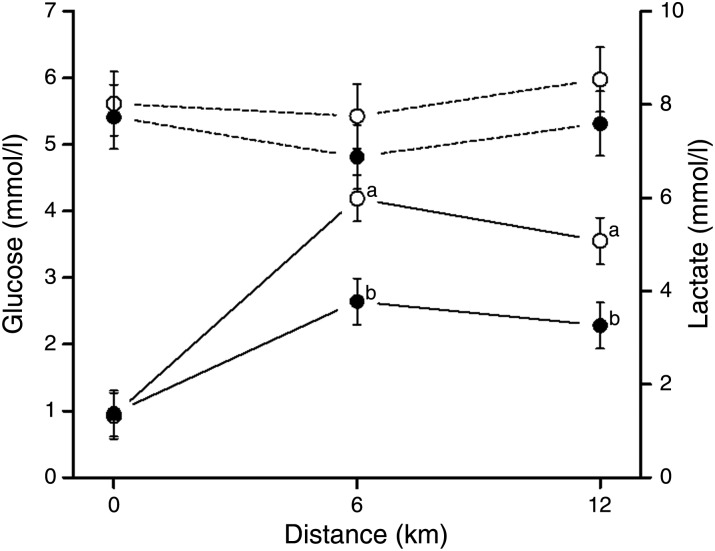
Fig. 2.
Blood glucose (---) and lactate (––) concentrations measured in dogs (n 8) during exercise in period 1 (○) and period 2 (●). Blood samples were taken pre- (0 km), midway (6 km) and post-exercise (12 km). Values are means, with standard errors represented by vertical bars. a,b Mean values with unlike letters were significantly different between the two periods (P < 0·05).

