Figure 3.
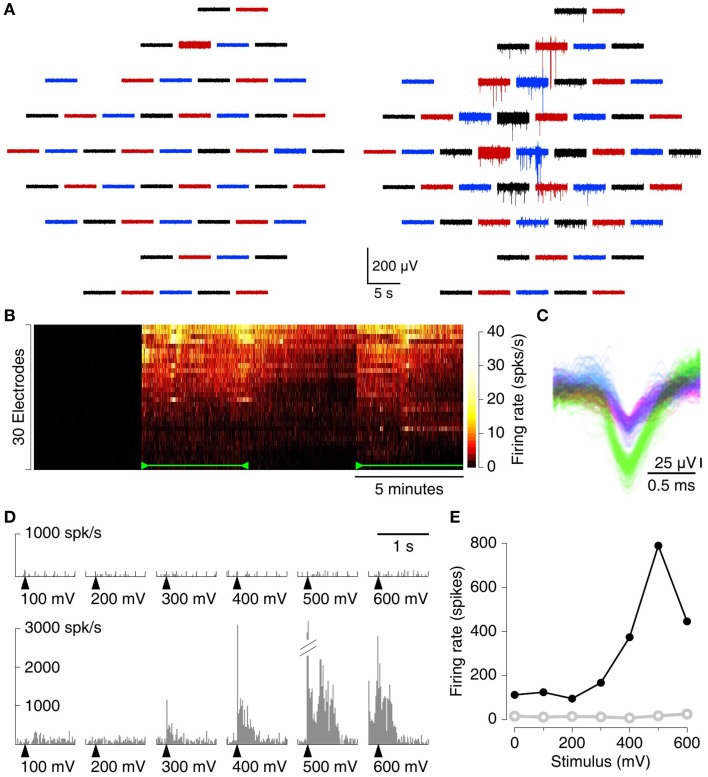
Recording spontaneous activity from cortico-hippocampal slices with an MSEA with an intercalated electrode design. (A) Simultaneously recorded traces from 60 electrodes before (left) and after (right) application of 80 mbar of suction. Each trace represents data from one electrode; traces in the graph are laid out in the same geometry as electrodes in the array. Colors only serve to guide the eye. (B) Heat map of firing rates on each of 30 electrodes (sorted in order of total spike count) with and without suction. Suction (110 mbar) was applied 5 min after the start of the recording, released at 10 min, and re-applied at 15 min (green marks). In this recording, no spikes were detected prior to suction at all. (C) Example from a single electrode of the waveforms of all spikes. Colors: units as identified by UltraMegaSort2000 (see Section 2.8). (D) Peristimulus time histogram of array-wide firing evoked by stimuli of varying voltage (arrowheads), before (top), and after (bottom) application of 80 mbar of suction. (E) Aggregate firing rates in the first 1s following stimulation before (open, gray) and after (solid, black) application of suction.

