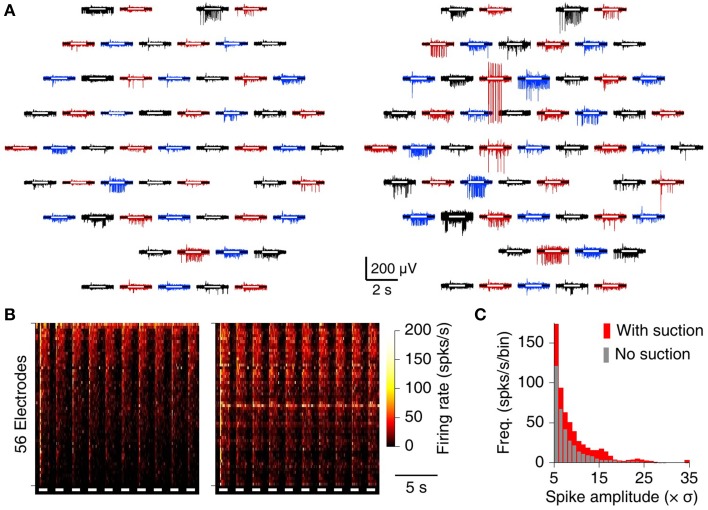
Figure 4.
MSEA recordings from retinal explant. (A) Raw data from 60 electrodes before (left) and after (right) application of suction. White bars inside each trace indicate timing of whole-field visual stimulation. (B) Heat map of array-wide response to visual stimuli (white bars) before (left) and after (right) application of suction. (C) Histogram of observed spike amplitudes (normalized to units of RMS noise) before (gray) and after (red) application of suction.

